
Support and Resistance: The Foundation of Technical Analysis
If there's one concept that every successful Forex trader must master, it's support and resistance. These fundamental price levels form the backbone of technical analysis and are used by traders worldwide to identify high-probability trading opportunities. Whether you're a complete beginner or an experienced trader, understanding how to identify support resistance levels and trade them effectively can dramatically improve your trading results.
Support and resistance are not mystical concepts—they're based on human psychology, market memory, and the natural supply-demand dynamics that drive every financial market. In this comprehensive guide, you'll learn what support and resistance levels are, how to identify them accurately, proven trading strategies, and advanced concepts that professional traders use daily.
1. What are Support and Resistance?
Support: The Price Floor
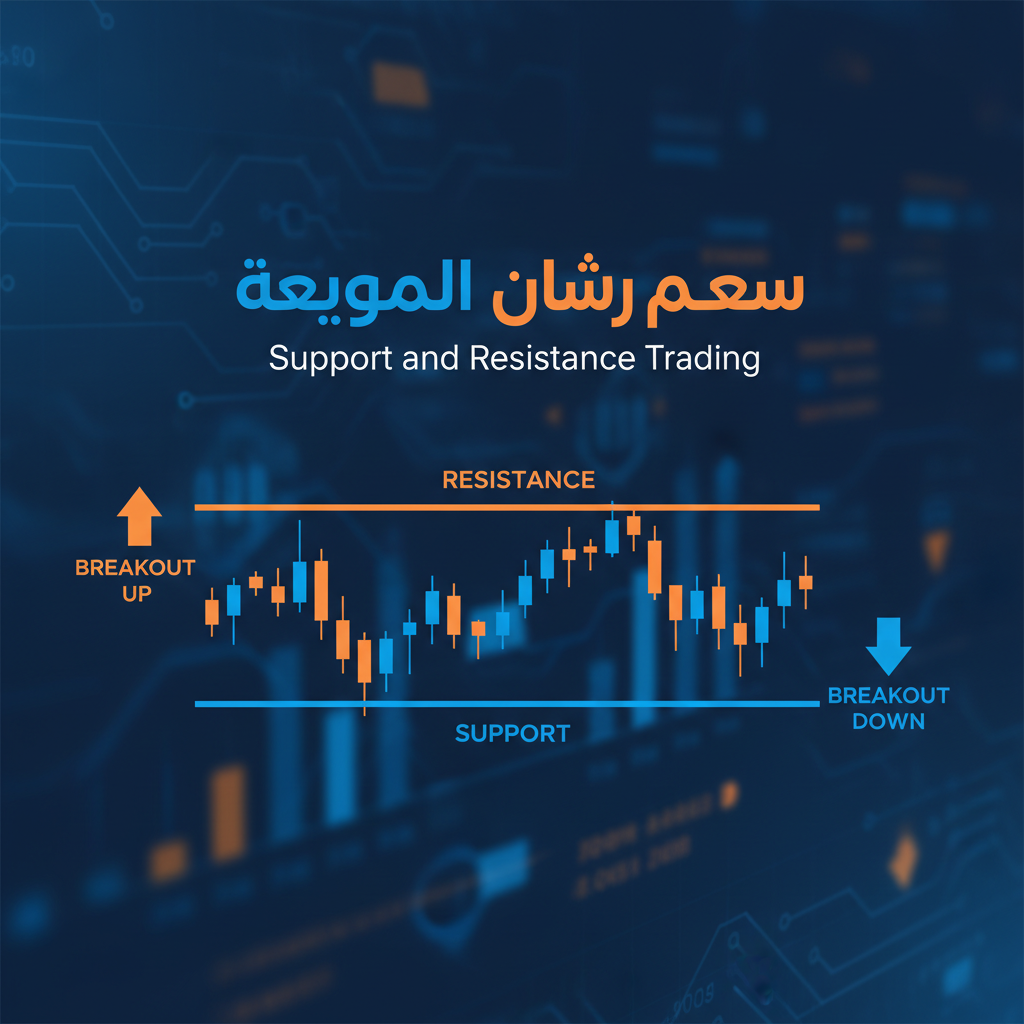
Support is a price level where buying pressure is strong enough to prevent the price from falling further. Think of it as a "floor" that holds the price up. When price approaches a support level, buyers step in, believing the currency pair is undervalued, creating demand that pushes the price back up.
Support levels form at previous swing lows—areas where the price has bounced up in the past. The logic is simple: if buyers were willing to buy at this price before, they're likely to do so again when price returns to that level.
Resistance: The Price Ceiling
Resistance is the opposite of support—a price level where selling pressure is strong enough to prevent the price from rising higher. It acts as a "ceiling" that caps upward movement. When price approaches resistance, sellers step in, believing the pair is overvalued, creating supply that pushes the price back down.
Resistance levels form at previous swing highs—areas where the price has reversed downward in the past. Traders remember these levels and are likely to sell when price returns, expecting another reversal.
The Psychology Behind S/R
Why do support and resistance work? The answer lies in market psychology and memory:
- Regret and Missed Opportunities: Traders who missed buying at a previous low wait for price to return to that level, creating buying pressure (support)
- Break-even Mentality: Traders trapped in losing positions at a high price are eager to exit at break-even when price returns, creating selling pressure (resistance)
- Profit-taking: Traders who bought at support take profits when price reaches previous resistance
- Institutional Orders: Large banks and funds place pending orders at historical levels, creating clusters of buying/selling interest
- Self-fulfilling Prophecy: Since millions of traders watch the same levels, collective action reinforces them
2. How to Identify Support and Resistance Levels
Identifying key levels forex traders watch is a critical skill. Here are the most effective methods:
Method 1: Horizontal Levels from Swing Highs and Lows
The most straightforward method is to identify swing highs (peaks) and swing lows (valleys) on your chart:
- Zoom Out: Start with higher timeframes (daily, 4-hour) to identify major levels
- Mark Swing Lows: Draw horizontal lines at obvious valleys where price bounced up
- Mark Swing Highs: Draw horizontal lines at obvious peaks where price reversed down
- Look for Clusters: Areas where multiple highs or lows align are stronger levels
- Connect the Dots: If price respected a level multiple times, that's a key S/R level
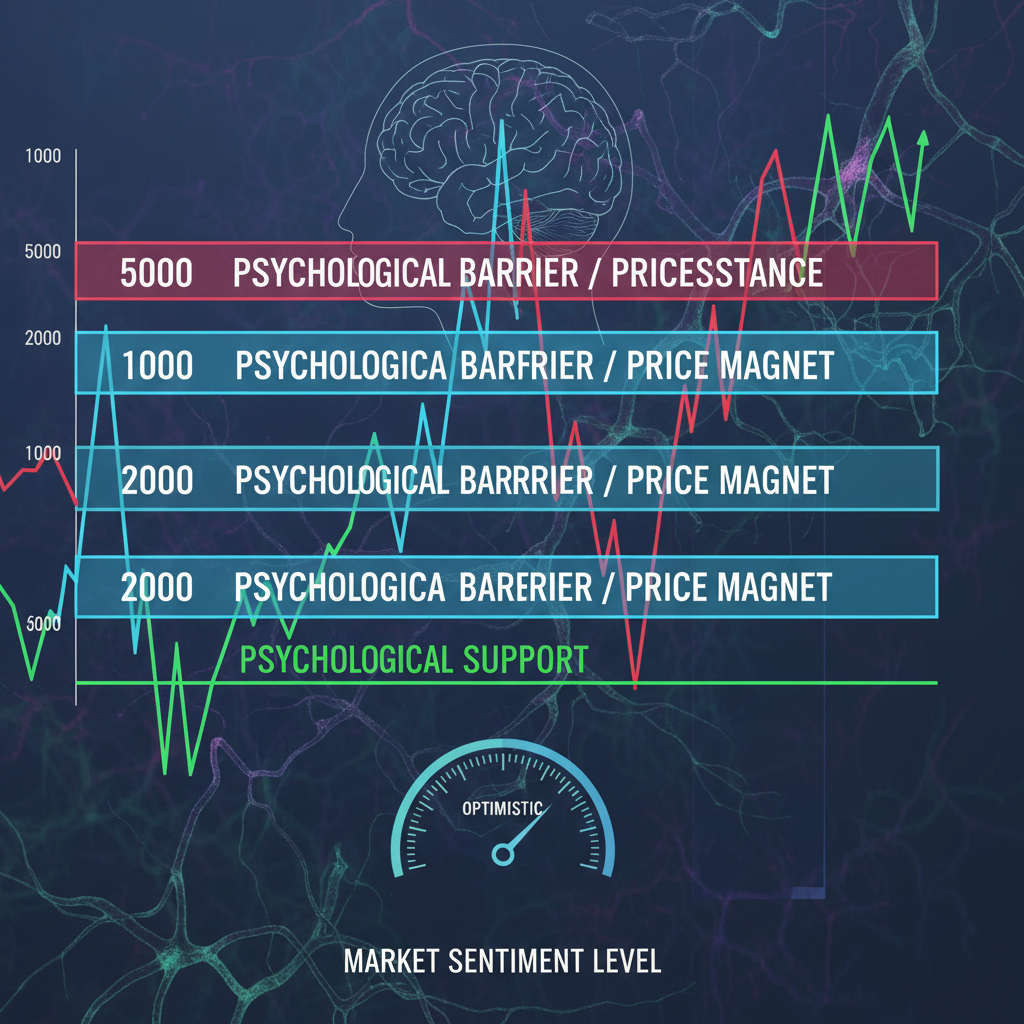
Method 2: Round Numbers (Psychological Levels)
Round numbers naturally act as support and resistance due to human psychology and institutional order placement:
| Level Type | Examples | Strength |
|---|---|---|
| Big Figures | 1.2000, 1.3000, 130.00 | Very Strong |
| Half Figures | 1.2500, 1.3500, 125.00 | Strong |
| Quarter Figures | 1.2250, 1.2750, 122.50 | Moderate |
| Minor Rounds | 1.2100, 1.2300, 123.00 | Weak to Moderate |
Traders and algorithms place pending orders at these levels, creating natural clustering. When EUR/USD approaches 1.2000, for example, expect significant activity.
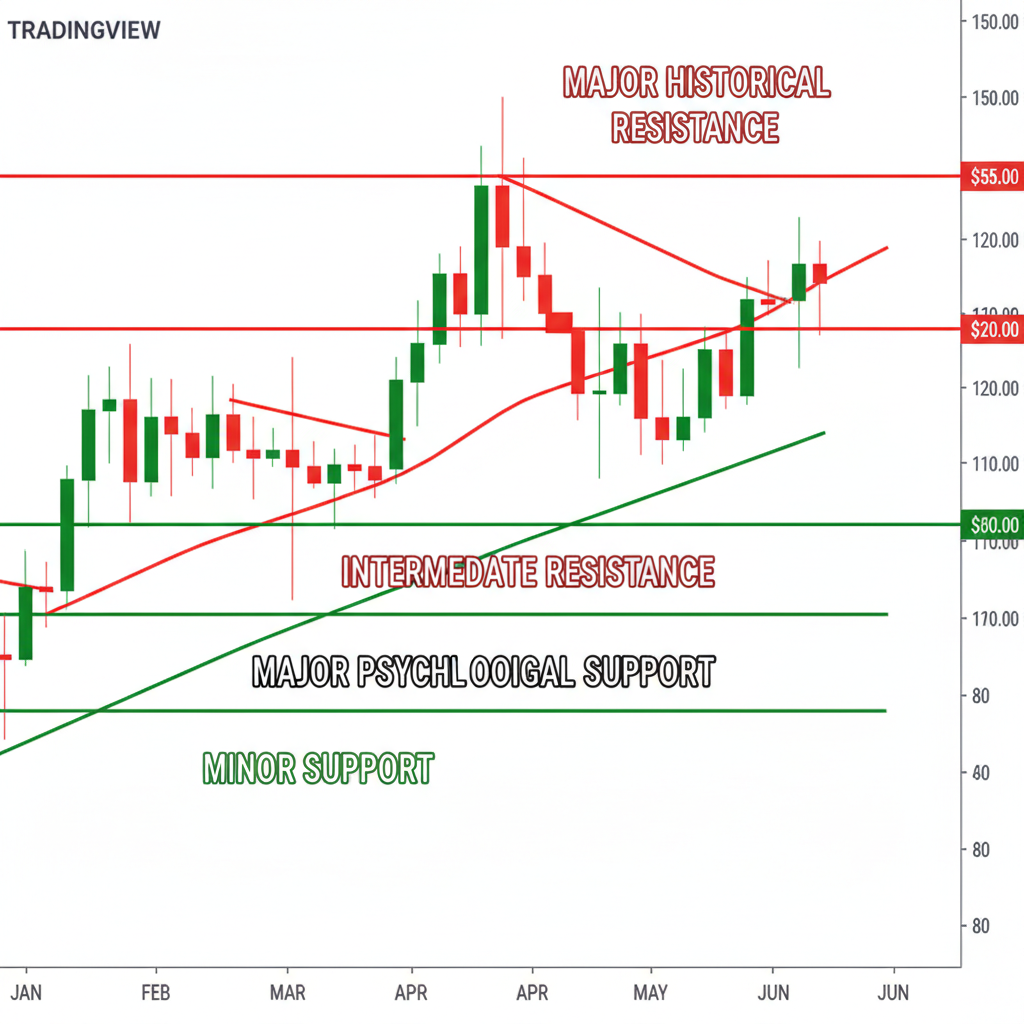
Method 3: Historical Levels
Price has memory. Levels that were significant in the past often remain significant:
- Previous All-Time Highs/Lows: Major historical turning points
- 52-Week Highs/Lows: Annual extremes attract attention
- Previous Monthly/Weekly Highs/Lows: Institutional traders watch these closely
- Gap Levels: Weekend gaps often get filled
Method 4: Multiple Timeframe Analysis
The most powerful S/R levels appear across multiple timeframes:
- Weekly Chart: Identify major multi-year S/R levels
- Daily Chart: Mark intermediate-term levels (weeks to months)
- 4-Hour Chart: Find short-term swing levels (days to weeks)
- Look for Alignment: When a level is visible on multiple timeframes, it's significantly stronger
🎯 Quick Identification Checklist
- ✅ Is this an obvious swing high or low visible on higher timeframes?
- ✅ Has price bounced off this level 2+ times in the past?
- ✅ Is this a round number or near one?
- ✅ Does the level align across multiple timeframes?
- ✅ Was there significant price action (large candles, wicks) at this level?
If you answered yes to 3+ questions, you've found a strong S/R level.
3. Types of Support and Resistance
Support and resistance come in different forms. Understanding each type enhances your analysis:
Horizontal Levels (Static S/R)
These are the most common type—fixed price levels that don't change over time:
- Previous swing highs and lows
- Historical support and resistance
- Round numbers
- Opening/closing prices of significant periods
Trading Tip: Horizontal levels work best in ranging or consolidating markets.
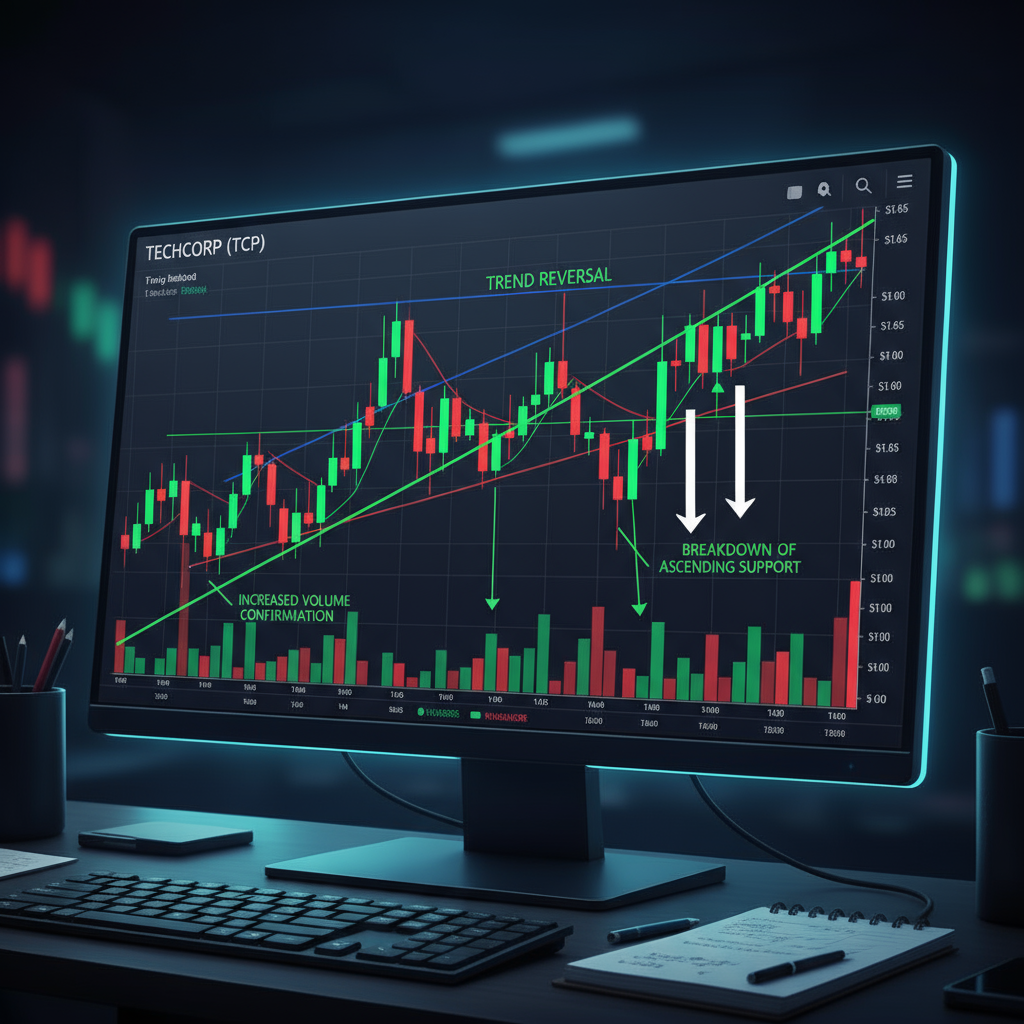
Diagonal Levels (Trend Lines)
Trend lines are dynamic S/R levels that change with time:
- Ascending Trend Line: Acts as support in an uptrend (connects higher lows)
- Descending Trend Line: Acts as resistance in a downtrend (connects lower highs)
- Channel Lines: Parallel lines containing price movement
Trading Tip: Trend line breaks often signal trend reversals.
Dynamic Levels (Moving Averages)
Moving averages act as moving support and resistance:
- 50-day EMA: Short to intermediate-term dynamic S/R
- 200-day EMA: Long-term dynamic S/R, highly respected
- 20-day SMA: Bollinger Band middle line, active S/R
When price is above the 200 EMA, the 200 EMA acts as support. When price is below, it acts as resistance.
Psychological Levels
As discussed, round numbers create natural S/R due to trader psychology and order clustering.
Pivot Points
Pivot points are calculated S/R levels based on previous day's high, low, and close:
- Central Pivot Point (PP)
- Support levels: S1, S2, S3
- Resistance levels: R1, R2, R3
Many institutional traders use pivot points, making them self-fulfilling.
4. Trading Strategies with Support and Resistance
Now for the practical part—how to actually trade support resistance levels profitably:
Strategy 1: The Bounce Strategy (Range Trading)
Best For: Ranging markets, consolidation periods
Timeframe: 4-hour to Daily charts
Entry Rules:
- ✅ Identify clear horizontal support and resistance levels
- ✅ Wait for price to approach support or resistance
- ✅ Look for reversal candlestick patterns (Pin Bar, Engulfing, Doji)
- ✅ Buy near support with confirmation
- ✅ Sell near resistance with confirmation
Stop-Loss: 10-20 pips below support (for buys) or above resistance (for sells)
Take-Profit: Opposite S/R level or 2:1 risk-reward minimum
Example: EUR/USD is ranging between 1.1800 (support) and 1.1900 (resistance). When price reaches 1.1805 and forms a bullish Pin Bar, buy with stop at 1.1785 and target 1.1890.
Strategy 2: The Breakout Strategy
Best For: Trending markets, end of consolidation
Timeframe: 1-hour to Daily charts
Entry Rules:
- ✅ Identify a key resistance level (for longs) or support (for shorts)
- ✅ Wait for price to break through the level with strong momentum
- ✅ Look for confirmation: Large candle, increased volume, candle close beyond level
- ✅ Enter on the breakout or slight pullback
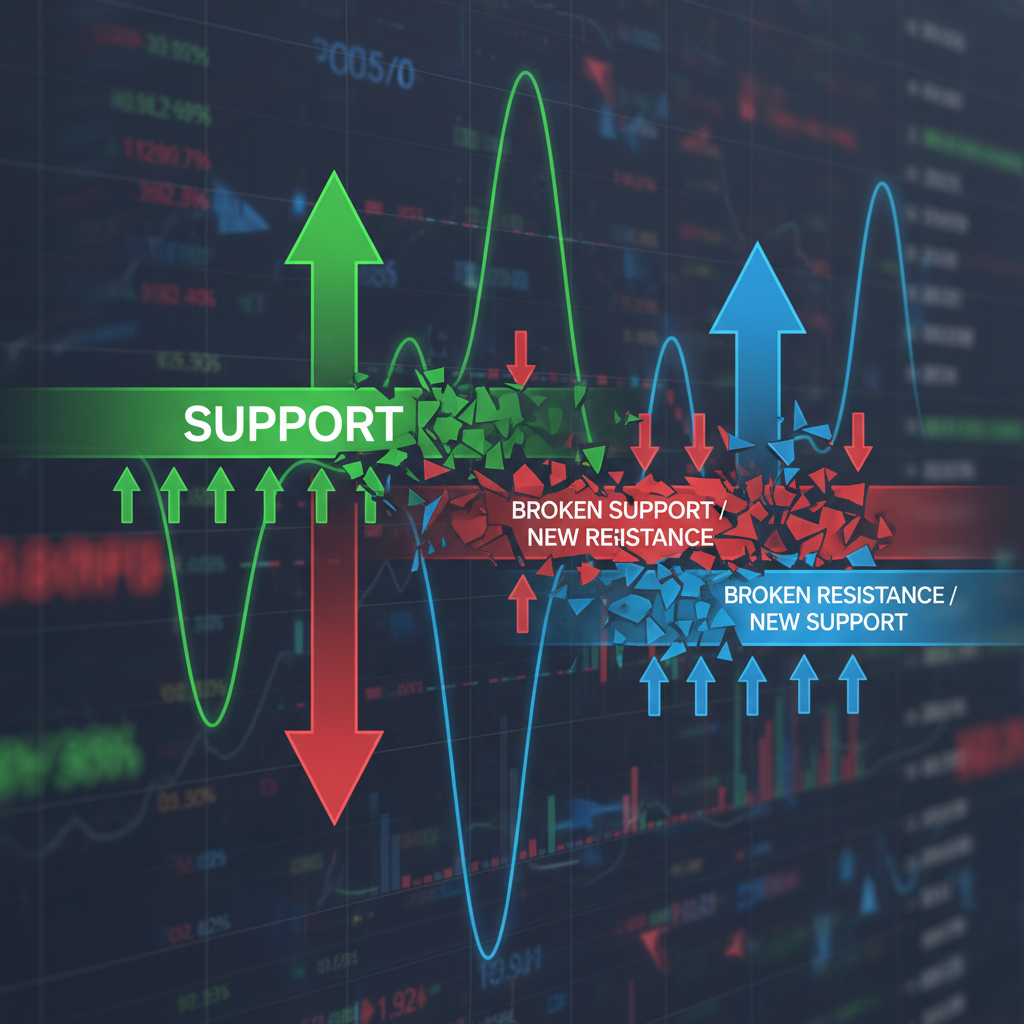
Stop-Loss: Below the broken level (resistance becomes support or vice versa)
Take-Profit: Next major S/R level or use trailing stop
False Breakout Filter: Only trade breakouts that close at least 10-15 pips beyond the level with strong momentum candles.
Strategy 3: The Retest Strategy (Role Reversal)
Best For: Post-breakout trends, high-probability entries
Timeframe: 4-hour to Daily charts
Entry Rules:
- ✅ Wait for a confirmed breakout of support or resistance
- ✅ Don't chase the initial breakout
- ✅ Wait patiently for price to pull back and retest the broken level
- ✅ The broken resistance should now act as support (or vice versa)
- ✅ Enter when price bounces off the retested level with confirmation
Stop-Loss: Beyond the retested level (20-30 pips safety margin)
Take-Profit: Next significant level or 3:1 risk-reward
Why This Works: Retests offer safer entries after the breakout traders have already proven the move is real. You get better risk-reward ratios.
Strategy 4: Range Trading Between Levels
Best For: Clear ranging markets, low volatility
Timeframe: 4-hour to Daily charts
Entry Rules:
- ✅ Identify a clear range with defined support and resistance
- ✅ Buy at the bottom of the range (support)
- ✅ Sell at the top of the range (resistance)
- ✅ Repeat until the range breaks
Stop-Loss: Beyond the range boundaries
Take-Profit: Opposite side of the range (or middle for conservative approach)
Exit Signal: When price breaks and closes beyond the range with momentum, the range is over. Switch to breakout trading.
- Candlestick reversal patterns (Pin Bar, Engulfing)
- Momentum indicators (RSI divergence, MACD crossover)
- Price action signals (rejection wicks, consolidation)
- Volume spikes (institutional interest)
5. Advanced Support and Resistance Concepts
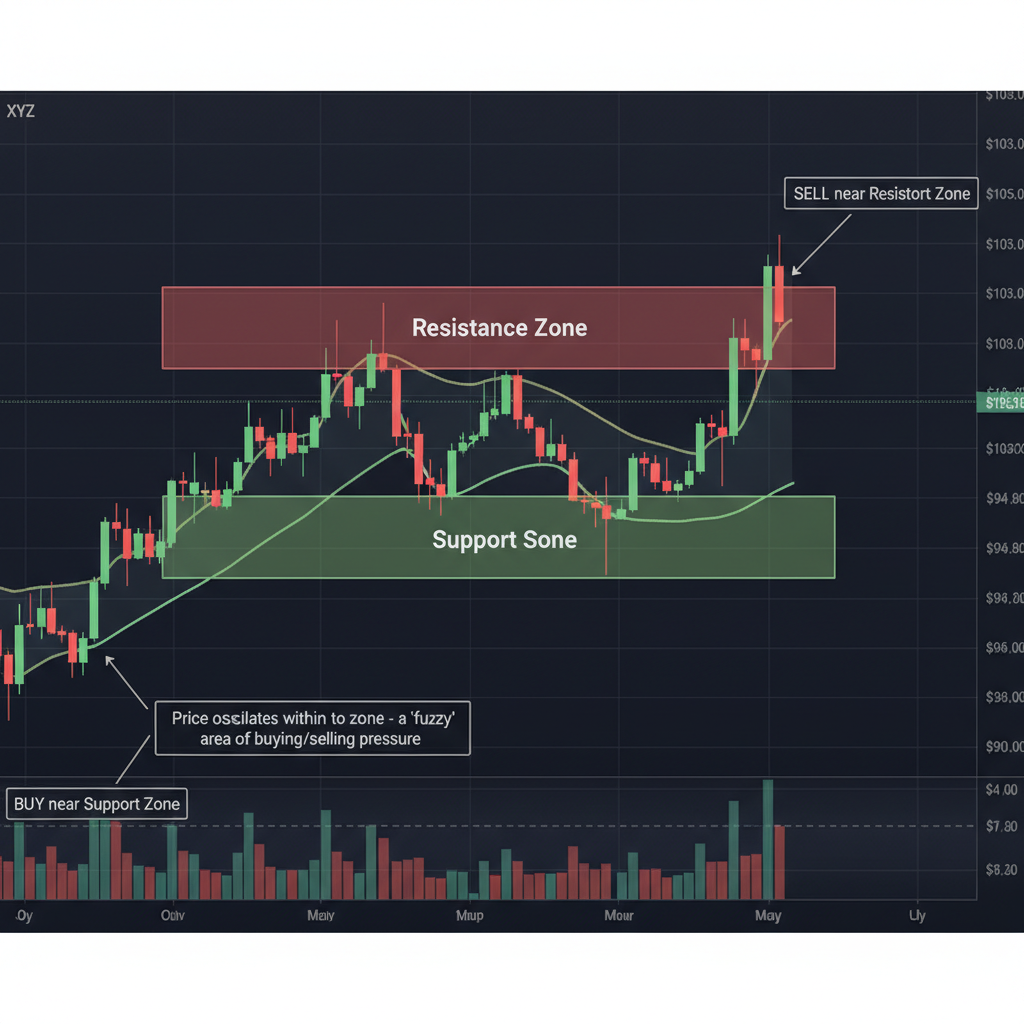
Zones vs. Lines: The Professional Approach
Beginners draw single lines. Professionals draw zones:
- Zone Width: Typically 10-30 pips depending on pair volatility
- Why Zones?: Market doesn't respect exact prices due to spreads, slippage, different broker quotes
- How to Draw: Shade the area between the highest wick and lowest body (or vice versa) at swing points
- Trading Zones: Look for entries anywhere within the zone, not just at the line
Confluence: The Power of Alignment
Confluence occurs when multiple technical factors align at the same price level, dramatically increasing its strength:
| Confluence Example | Combined Factors | Probability |
|---|---|---|
| High-Probability Support | Previous Swing Low + 200 EMA + Round Number (1.2000) + 61.8% Fibonacci | Very High |
| Moderate Support | Swing Low + Trend Line | Moderate |
| Strong Resistance | Previous High + Pivot Point R1 + 50 EMA | High |
Pro Tip: The more confluence factors present (3+), the more likely the level will hold, and the better the risk-reward becomes.
Order Blocks and Institutional Levels
Advanced traders look beyond simple swing highs/lows to identify order blocks:
- Bullish Order Block: Last down candle before strong upward move (institutional buying)
- Bearish Order Block: Last up candle before strong downward move (institutional selling)
- How to Use: These blocks often act as future support/resistance when price returns
- Why They Work: Represent areas where large institutions placed orders
Supply and Demand Zones
Related to order blocks, supply and demand zones represent areas of institutional activity:
- Demand Zone: Area where strong buying emerged (price rallied sharply from this zone)
- Supply Zone: Area where strong selling emerged (price dropped sharply from this zone)
- Fresh vs. Tested: Fresh (untested) zones are stronger than zones that have been touched multiple times
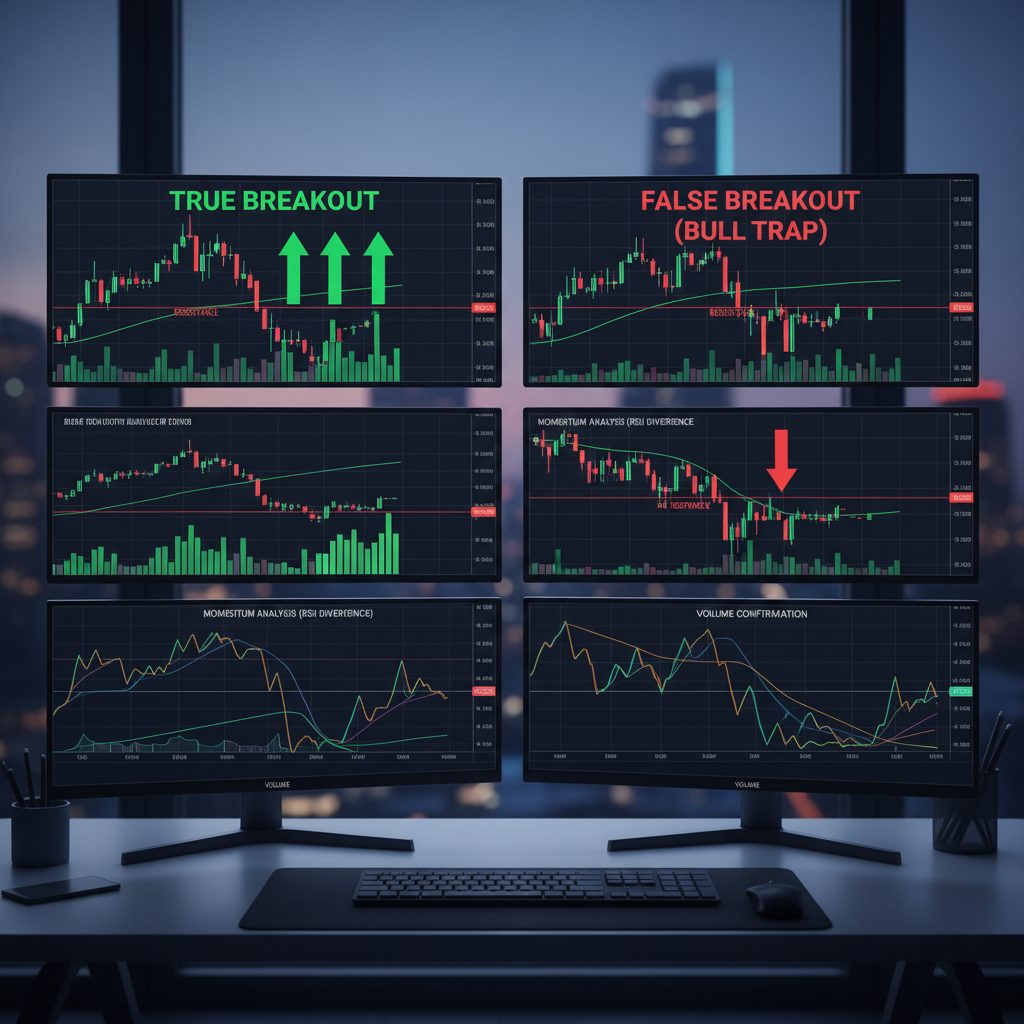
False Breakouts and Stop Hunts
Not all breakouts are real. False breakouts (fakeouts) are common:
- What Happens: Price briefly breaks a level, triggers stop-losses, then reverses
- Why It Happens: Market makers hunt retail stop-losses clustered just beyond levels
- How to Avoid:
- Wait for candle close beyond the level (don't trade wicks)
- Use the 3% rule (wait for 3% move beyond level)
- Look for strong momentum and volume confirmation
- Avoid trading breakouts during low-liquidity hours
❓ Frequently Asked Questions
⚠️ Risk Disclaimer
Trading foreign exchange (Forex) carries substantial risk and may not be suitable for all investors. Support and resistance levels are tools for analysis, not guarantees of future price movements. Markets can and do break through even the strongest levels unpredictably.
Before trading Forex, you should carefully consider your investment objectives, level of experience, and risk appetite. The possibility exists that you could sustain losses in excess of your initial deposit. Only trade with money you can afford to lose.
This article is for educational purposes only and does not constitute financial advice, investment advice, or trading recommendations. Past performance of support and resistance levels is not indicative of future results. Always conduct your own analysis and consult with licensed financial advisors before making trading decisions.
Risk Management is Mandatory: Never risk more than 1-2% of your trading capital on a single trade, always use stop-loss orders, and never trade based solely on support and resistance without confirmation from other technical analysis tools. Trading without proper risk management can lead to substantial financial losses.
Comments
Post a Comment