
RSI Indicator: How to Use Relative Strength Index in Forex
1. Understanding the RSI Indicator
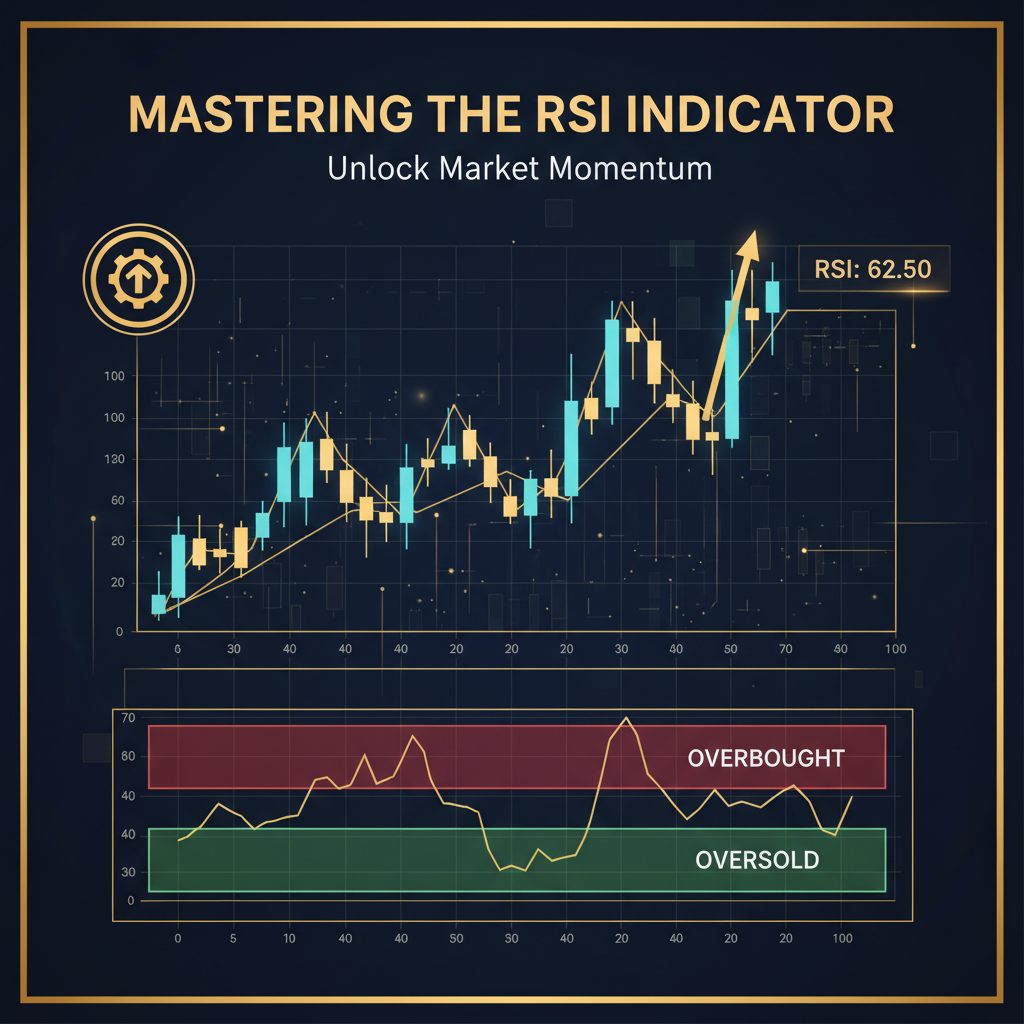
The RSI indicator (Relative Strength Index) stands as one of the most powerful and widely-used momentum oscillators in forex trading. Developed by J. Welles Wilder Jr. in 1978, this technical indicator has helped countless traders identify potential reversal points and optimize their trading decisions for over four decades.
At its core, the RSI is a momentum oscillator that measures the speed and change of price movements by comparing the magnitude of recent gains against recent losses. Unlike trend-following indicators that lag behind price action, the RSI provides real-time insights into whether a currency pair might be overbought or oversold, making it invaluable for timing market entries and exits.
What Makes RSI Special?
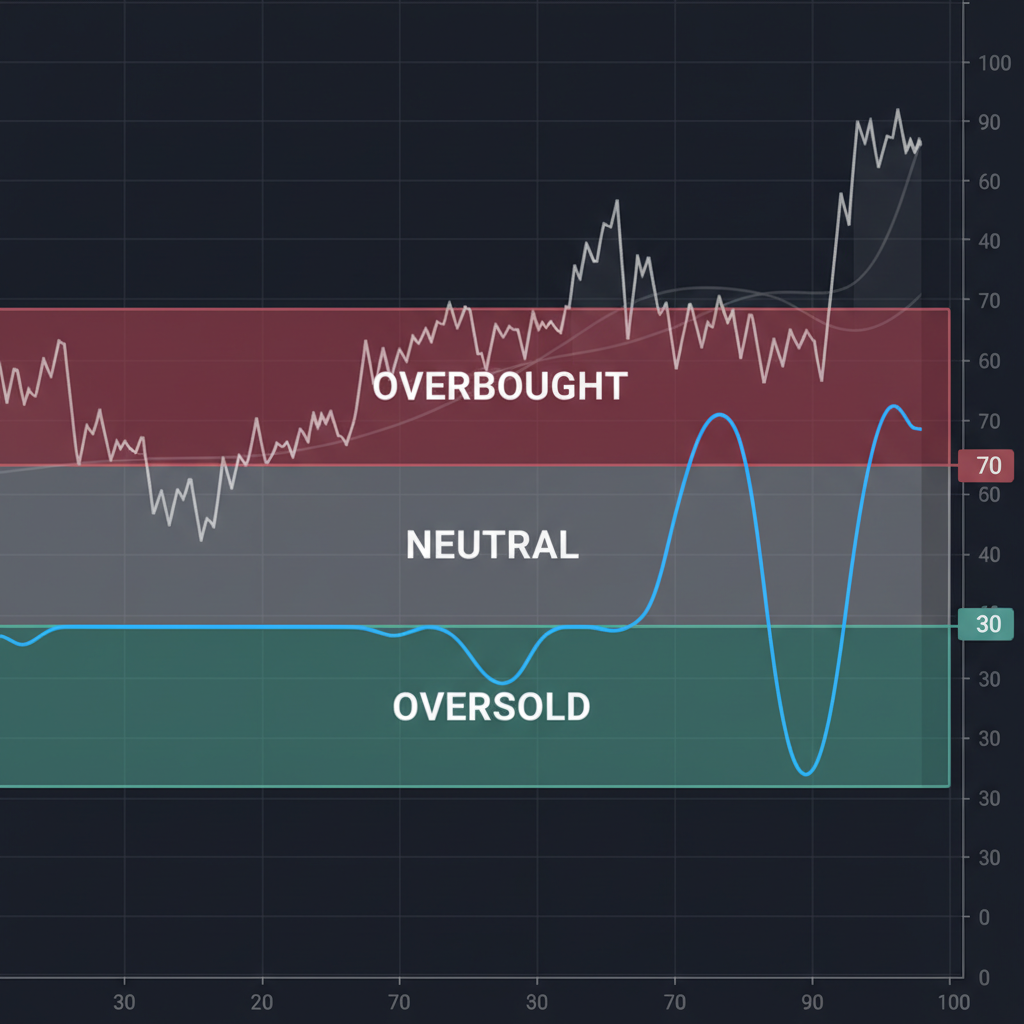
The RSI operates on a scale from 0 to 100, with specific zones that indicate different market conditions. When the RSI reads above 70, it typically suggests that the currency pair is overbought and might be due for a pullback. Conversely, readings below 30 indicate oversold conditions, potentially signaling an upcoming bounce or reversal.
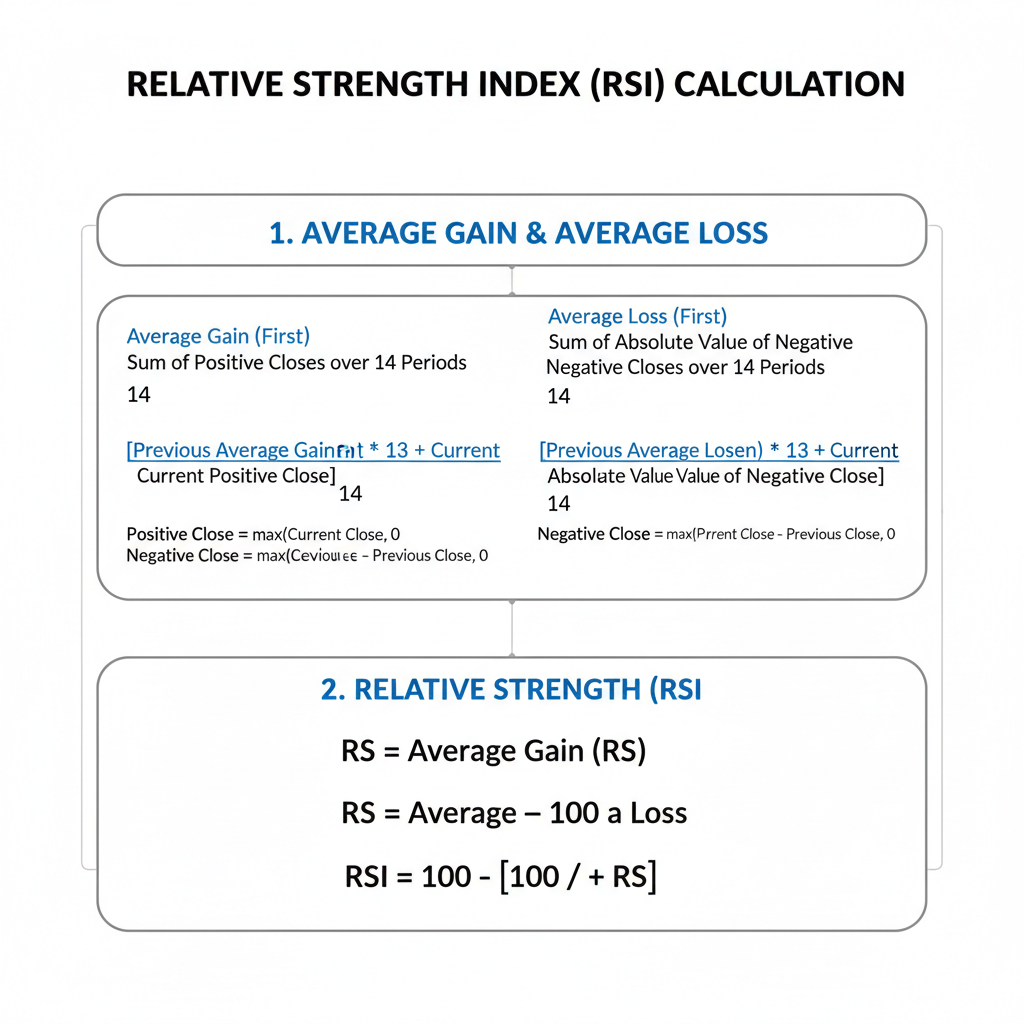
RSI Calculation (Simplified)
RSI = 100 - (100 / (1 + RS))
Where RS = Average Gain / Average Loss over the specified period (typically 14)
Don't worry - your trading platform calculates this automatically!
The standard RSI period setting is 14, meaning it analyzes the last 14 price periods (candles) to generate its reading. This 14-period setting strikes an excellent balance between sensitivity and reliability, though traders often adjust this based on their trading style and market conditions.
What sets the RSI apart from other oscillators is its bounded nature – it cannot exceed 100 or fall below 0, making interpretation straightforward and consistent across different currency pairs and timeframes. This reliability has made it a cornerstone indicator for both beginner and professional traders worldwide.
2. Reading RSI Signals
Understanding how to properly read RSI signals is crucial for successful forex trading. The indicator provides several types of signals, each offering unique insights into market momentum and potential price direction.
The Three RSI Zones
| RSI Level | Market Condition | Trading Implication | Action to Consider |
|---|---|---|---|
| Above 70 | Overbought | Potential selling pressure | Look for short opportunities |
| 30 - 70 | Neutral Zone | Balanced momentum | Wait for clear signals |
| Below 30 | Oversold | Potential buying pressure | Look for long opportunities |
Overbought Conditions (RSI > 70)
When the RSI climbs above 70, it indicates that buying pressure has been dominant and the currency pair might be overextended to the upside. This doesn't necessarily mean you should immediately sell – rather, it suggests increased caution and preparation for a potential reversal or pullback.
In strong trending markets, the RSI can remain in overbought territory for extended periods. Professional traders often wait for the RSI to actually turn down from overbought levels rather than acting solely on the crossing above 70. This approach helps filter out false signals in trending markets.
Oversold Conditions (RSI < 30)
Conversely, when the RSI drops below 30, it signals that selling pressure has been intense and the pair might be oversold. This creates potential buying opportunities, especially when confirmed by other technical factors such as support levels or bullish candlestick patterns.
Professional Tip: RSI in Different Market Conditions
Trending Markets: In strong trends, RSI extremes can persist longer. Wait for actual reversals from extreme levels.
Range-bound Markets: RSI extremes are more reliable for reversal trading as price tends to bounce between support and resistance.
High Volatility: Consider using wider RSI bands (25-75) instead of the standard 30-70 to avoid false signals.
The Neutral Zone (30-70)
The area between 30 and 70 represents neutral momentum where neither buying nor selling pressure dominates significantly. During these periods, traders often wait for the RSI to approach the extreme zones or look for other technical signals to guide their decisions.
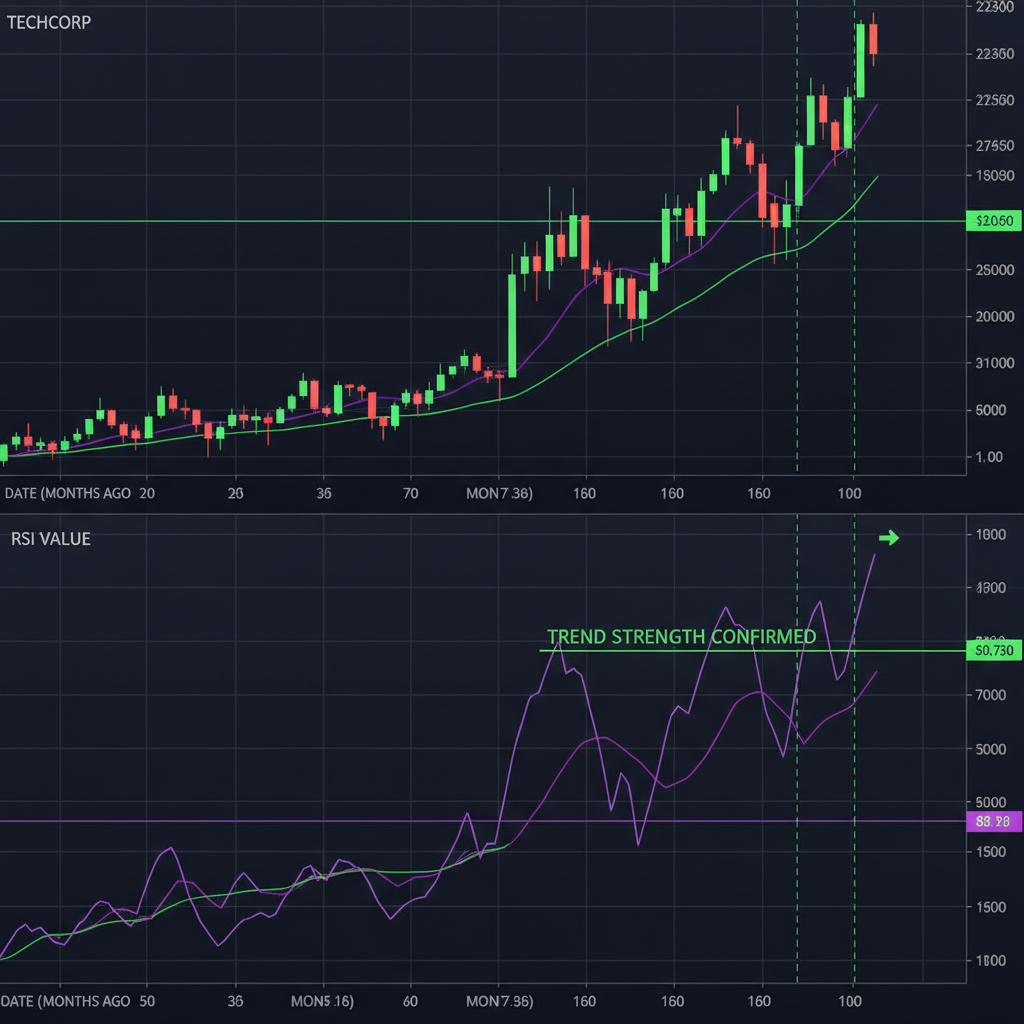
The 50 level within this neutral zone is particularly significant as it often acts as a dynamic support or resistance level for the RSI itself. When the RSI is above 50, it suggests bullish momentum, while readings below 50 indicate bearish momentum.
3. RSI Trading Strategies
The RSI indicator offers multiple trading approaches, each suited to different market conditions and trading styles. Here are the five most effective RSI trading strategies that professional forex traders use consistently.
Strategy 1: Overbought/Oversold Reversal Trading
Setup Requirements:
- RSI crosses above 70 (overbought) or below 30 (oversold)
- Wait for RSI to turn back toward the neutral zone
- Confirm with price action (rejection candles, doji, etc.)
- Enter when RSI crosses back below 70 or above 30
Example: EUR/USD shows RSI at 75, then forms a shooting star candlestick. As RSI turns down and crosses below 70, enter a short position with stop loss above recent high.
This foundational strategy works best in range-bound or sideways markets where prices tend to respect support and resistance levels. The key is patience – don't rush to trade simply because RSI reaches extreme levels. Wait for confirmation that momentum is actually shifting.
Strategy 2: RSI Divergence Trading
RSI divergence occurs when price and the RSI indicator disagree about the direction of momentum. This powerful signal often precedes significant reversals and provides some of the highest probability trading setups.
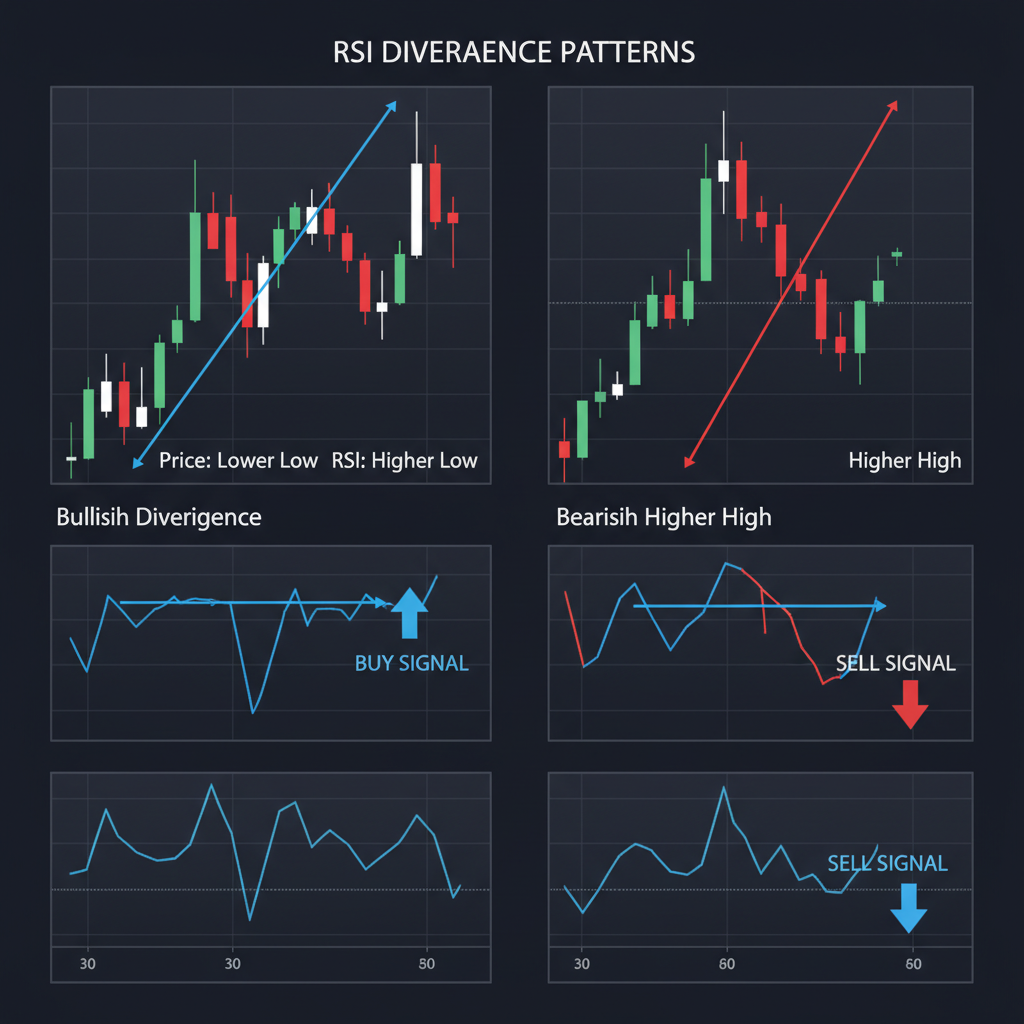
Types of RSI Divergence:
Bullish Divergence: Price makes lower lows while RSI makes higher lows (suggests upward reversal)
Bearish Divergence: Price makes higher highs while RSI makes lower highs (suggests downward reversal)
Hidden Divergence: Indicates trend continuation rather than reversal
To trade divergence effectively, connect the swing highs or lows on both price and RSI. When you see disagreement between the two, prepare for a potential reversal. The best divergence setups occur at key support or resistance levels where other technical factors align.
Strategy 3: RSI Centerline Crossover
The RSI centerline at 50 acts as a dynamic momentum filter. When RSI crosses above 50, it suggests bullish momentum is building. When it crosses below 50, bearish momentum takes control. This strategy works exceptionally well in trending markets.
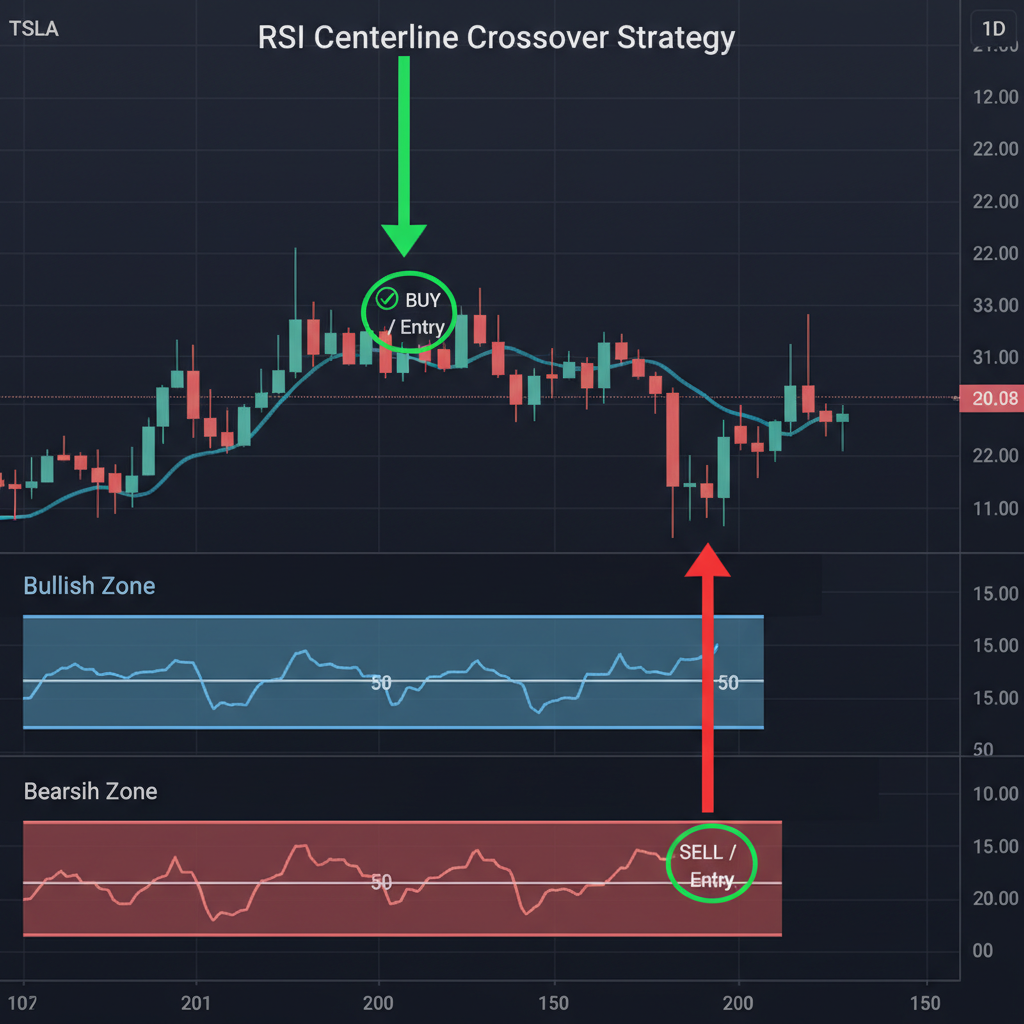
Centerline Trading Rules:
Buy Signal: RSI crosses above 50 + price breaks above recent resistance
Sell Signal: RSI crosses below 50 + price breaks below recent support
Stop Loss: Place beyond the recent swing high/low that triggered the signal
Take Profit: Target next major support/resistance level
Strategy 4: RSI Trendline Breakouts
Just like price action, RSI can form trendlines, support and resistance levels, and chart patterns. When these formations break on the RSI, they often precede similar breaks in price action, giving traders an early warning system.
Draw trendlines connecting RSI highs or lows, then watch for breakouts. A bullish RSI trendline breakout (higher highs in RSI) often signals that price will follow suit. This technique is particularly powerful when combined with price-based trendline analysis.
Strategy 5: RSI Failure Swings
Advanced Pattern: RSI Failure Swings
Bullish Failure Swing: RSI dips below 30, rallies above 30, pulls back (but stays above 30), then breaks the previous rally high
Bearish Failure Swing: RSI rises above 70, falls below 70, rallies (but stays below 70), then breaks the previous rally low
These patterns indicate strong momentum shifts and often lead to significant price moves.
Failure swings represent some of the most reliable RSI signals but require patience and precise timing. They work best when confirmed by price action and other technical indicators.
4. Combining RSI with Other Indicators
While the RSI is powerful on its own, combining it with other technical indicators creates more robust trading systems with higher success rates. The key is choosing complementary indicators that provide different types of market information.
RSI + Moving Averages
Moving averages provide trend direction while RSI indicates momentum strength. This combination helps traders align their RSI signals with the overall market trend, significantly improving win rates.
MA + RSI Strategy Setup:
Bullish Setup: Price above 200 EMA + RSI crosses above 30 from oversold
Bearish Setup: Price below 200 EMA + RSI crosses below 70 from overbought
Trend Filter: Only take longs when price is above the moving average, and shorts when below
The 50 EMA and 200 EMA are particularly effective trend filters. When price remains above these moving averages, focus primarily on RSI oversold bounces for long positions. When price is below, concentrate on RSI overbought levels for short opportunities.
RSI + Support and Resistance Levels
Combining RSI signals with key support and resistance levels creates high-probability confluence setups. When RSI shows oversold conditions at a major support level, the combination provides strong bullish confluence. Similarly, overbought RSI at resistance offers excellent shorting opportunities.
Look for RSI extremes to occur near round numbers (1.3000, 1.2500), previous swing highs/lows, and psychological levels. These confluences often produce the most reliable reversal signals.
RSI + MACD Confirmation
The MACD (Moving Average Convergence Divergence) provides trend and momentum information that complements RSI beautifully. When both indicators align, they create powerful confirmation signals.
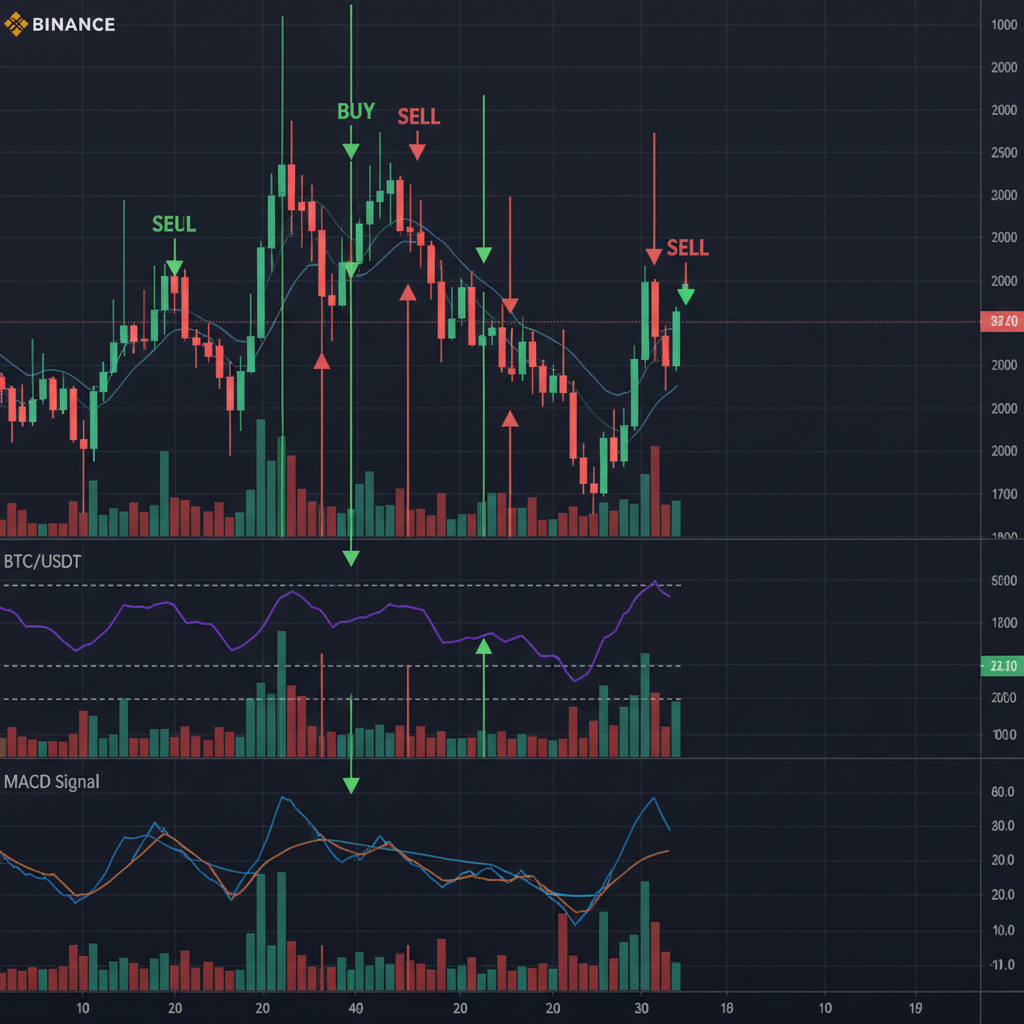
| RSI Signal | MACD Confirmation | Trade Setup | Strength |
|---|---|---|---|
| Oversold bounce | MACD bullish crossover | Strong long signal | High |
| Overbought reversal | MACD bearish crossover | Strong short signal | High |
| RSI divergence | MACD divergence | Reversal confirmation | Very High |
RSI + Bollinger Bands
Bollinger Bands provide volatility context that enhances RSI interpretation. When price touches the upper Bollinger Band while RSI shows overbought conditions, it creates a strong reversal setup. Conversely, price at the lower band with oversold RSI often signals excellent buying opportunities.
Bollinger + RSI Trade Example:
GBP/USD touches the lower Bollinger Band at 1.2450 support level. RSI reads 28 (oversold). Price forms a hammer candlestick. This triple confluence suggests a high-probability long setup with stop loss below the hammer's low and target at the middle Bollinger Band.
5. Advanced RSI Tips and Settings
Mastering the RSI requires understanding how to optimize its settings for different market conditions and trading styles. While the default 14-period setting works well for most situations, advanced traders often adjust these parameters to match their specific needs.
Adjusting RSI Periods
| RSI Period | Sensitivity | Best For | Trade-offs |
|---|---|---|---|
| 9 periods | High | Scalping, day trading | More signals, more false signals |
| 14 periods | Balanced | Most trading styles | Good balance of accuracy and frequency |
| 21 periods | Low | Swing trading, position trading | Fewer but more reliable signals |
Shorter periods like 9 make the RSI more responsive to price changes, generating more signals but also more false alarms. This setting works well for scalpers and day traders who need quick signals and can manage the increased noise. Longer periods like 21 smooth out the RSI, producing fewer but typically more reliable signals suitable for swing traders.
Customizing Overbought/Oversold Levels
The traditional 70/30 levels aren't carved in stone. Advanced traders adjust these levels based on market volatility and currency pair characteristics.
Alternative RSI Levels:
Volatile Pairs (GBP/JPY, GBP/CHF): Use 75/25 or 80/20 to avoid premature signals
Stable Pairs (EUR/CHF): Use 65/35 for earlier signals in low-volatility environments
Trending Markets: Use 80/20 to avoid fighting strong trends
Range Markets: Use 70/30 or even 65/35 for more frequent reversal signals
Multiple Timeframe RSI Analysis
Professional traders often analyze RSI across multiple timeframes to get a comprehensive view of momentum. This approach helps confirm signals and avoid trades that go against longer-term momentum.
For example, if you're day trading on the 15-minute chart, check the RSI on the 1-hour and 4-hour charts. If the 4-hour RSI is oversold while the 15-minute RSI gives a buy signal, you have strong confluence for a long position. Conversely, if higher timeframes show overbought conditions, be cautious about taking long positions on shorter timeframes.
Common RSI Mistakes to Avoid
Critical RSI Trading Mistakes:
- Trading against the trend: Don't short just because RSI is overbought in an uptrend
- Ignoring confirmation: Always wait for price action confirmation before entering
- Over-relying on RSI: Use it as part of a complete trading system, not in isolation
- Fighting strong trends: RSI can stay extreme for extended periods in trending markets
- Ignoring market context: Economic news and events can override technical signals
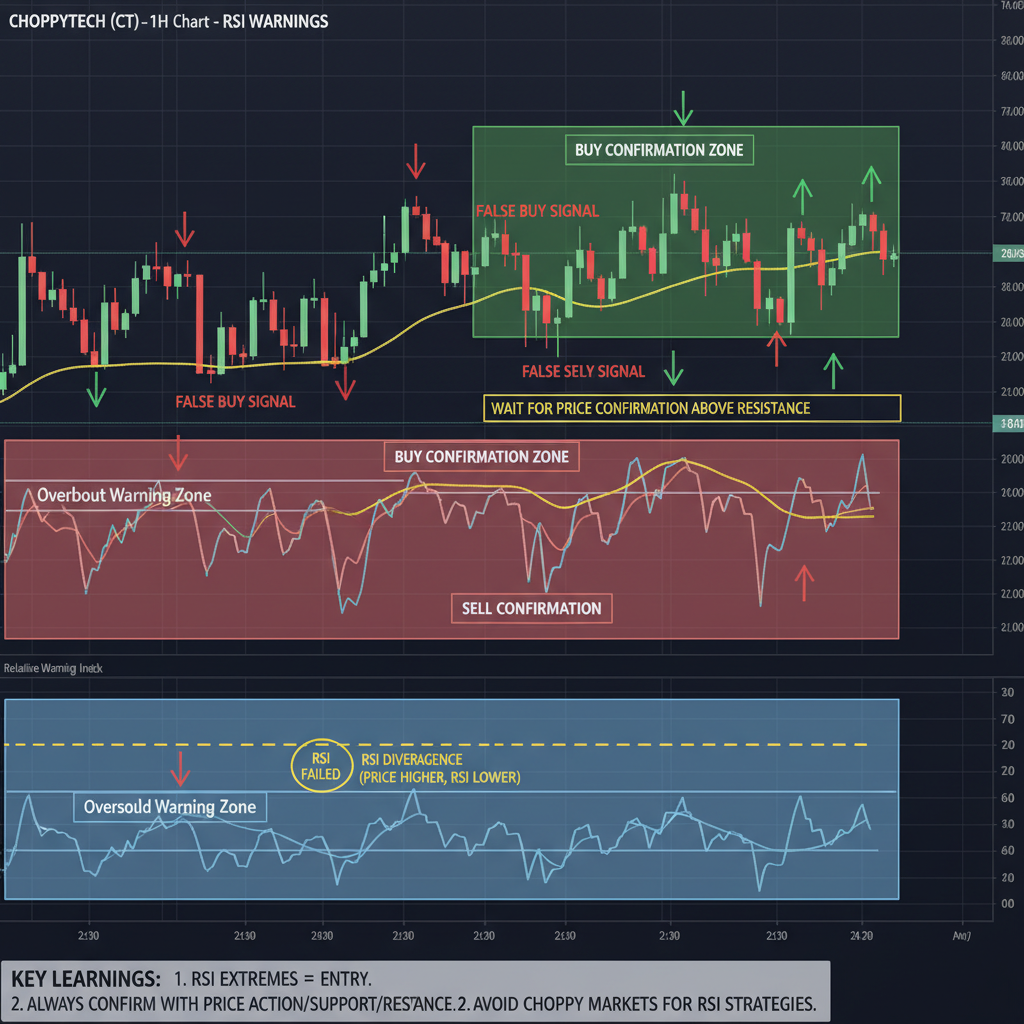
When RSI Doesn't Work Well
Understanding when RSI is less reliable helps avoid costly mistakes. RSI struggles during:
Strong trending markets: The indicator can remain in extreme territory for extended periods, leading to premature entries against the trend. During such times, focus more on trend-following strategies rather than reversal signals.
News-driven volatility: Economic announcements and unexpected events can cause sharp price movements that override technical signals. During high-impact news events, consider stepping aside until volatility subsides.
Low volatility periods: During extremely quiet market conditions, RSI may give false signals as minor price movements can trigger overbought/oversold readings without significant follow-through.
Frequently Asked Questions About RSI
Key Takeaways
- RSI is a momentum oscillator ranging from 0-100, with 70+ indicating overbought and 30- indicating oversold conditions
- The most reliable signals come from RSI reversals from extreme levels, not just reaching those levels
- RSI divergence provides powerful reversal signals when price and indicator disagree
- Combine RSI with trend analysis, support/resistance, and other indicators for better accuracy
- Adjust RSI settings (period and levels) based on market volatility and your trading style
- Be cautious during strong trends when RSI can stay extreme for extended periods
The RSI indicator remains one of the most valuable tools in a forex trader's arsenal when used correctly. Its ability to identify momentum shifts, overbought/oversold conditions, and divergence patterns makes it indispensable for both new and experienced traders. Remember that successful RSI trading requires patience, proper risk management, and confirmation from other technical factors.
Start by mastering the basic overbought/oversold strategy in demo trading, then gradually incorporate more advanced techniques like divergence trading and multi-timeframe analysis. With practice and proper application, the RSI can significantly improve your trading accuracy and help you identify high-probability opportunities in the dynamic forex market.
Comments
Post a Comment