
Price Action Trading: Reading the Market Without Indicators
1. What is Price Action Trading?
Price action trading represents the purest form of market analysis, focusing exclusively on price movements without relying on technical indicators. This approach treats price as the ultimate source of truth, believing that all market information - including news, sentiment, and economic data - is already reflected in price movements.
At its core, price action trading involves reading and interpreting candlestick formations, identifying key support and resistance levels, and understanding market structure to make trading decisions. Professional traders and institutional investors have used these techniques for decades because they provide direct insight into market psychology and supply-demand dynamics.
Benefits of Price Action Trading
The primary advantage of price action trading lies in its simplicity and effectiveness. Unlike indicator-based strategies that can produce conflicting signals, price action provides clear, unfiltered market information. Traders can identify trend direction, potential reversal points, and continuation patterns directly from price charts.
Price action trading also eliminates the lag inherent in technical indicators, which are calculated from past price data. By focusing on current price behavior, traders can spot opportunities earlier and react more quickly to market changes. This approach works across all timeframes, from scalping to long-term position trading, making it incredibly versatile.
The Learning Curve
Mastering price action trading requires patience and dedication. Unlike mechanical indicator-based systems, price action analysis involves subjective interpretation that improves with experience. New traders often struggle initially because price action patterns can appear ambiguous without proper context.
However, this initial difficulty becomes a significant advantage once mastered. Price action skills transfer across all markets and timeframes, providing traders with a universal language for understanding market behavior. The investment in learning price action pays dividends throughout a trader's career.
2. Essential Price Action Concepts
Understanding fundamental price action concepts forms the foundation for successful trading. These core principles help traders identify market structure, trend direction, and potential reversal or continuation points. Mastering these concepts is crucial before advancing to specific trading strategies.
Support and Resistance Levels
Support and resistance represent the most fundamental concepts in price action trading. Support levels act as price floors where buying interest historically emerges, preventing further declines. Resistance levels function as price ceilings where selling pressure typically increases, halting upward movement.
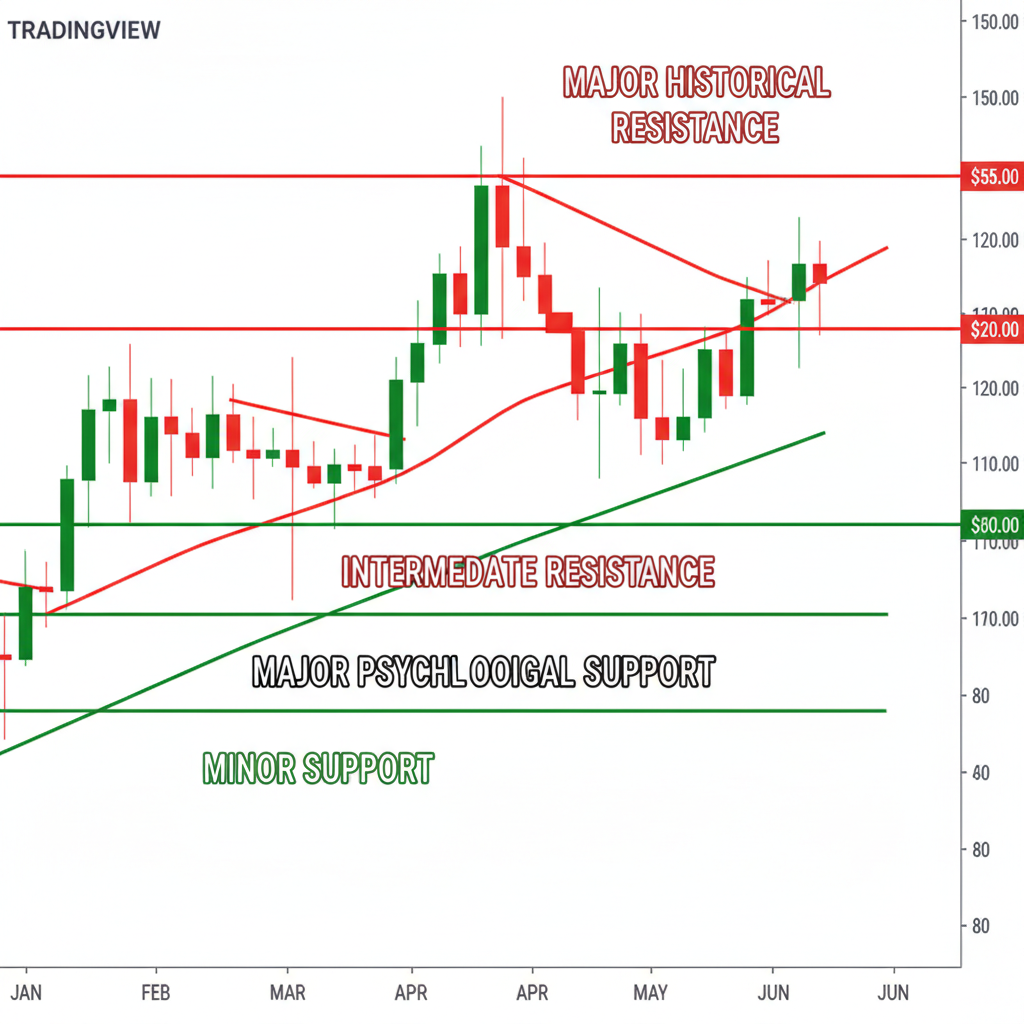
Figure 1: Key support and resistance levels showing price reactions and breakthrough scenarios
These levels gain significance through multiple interactions. The more times price respects a particular level, the stronger it becomes. However, when support or resistance breaks decisively, it often leads to significant price movements as trapped traders exit positions and new momentum emerges.
Professional traders identify support and resistance using multiple approaches: horizontal levels from previous swing highs and lows, trendlines connecting multiple price points, and psychological round numbers that attract institutional attention. The key is understanding that these levels represent zones rather than exact prices.
Trend Structure Analysis
Trend structure analysis involves identifying the direction and strength of market movements through price action. In uptrends, markets create higher highs and higher lows, while downtrends produce lower highs and lower lows. Understanding this structure helps traders align with dominant market forces.
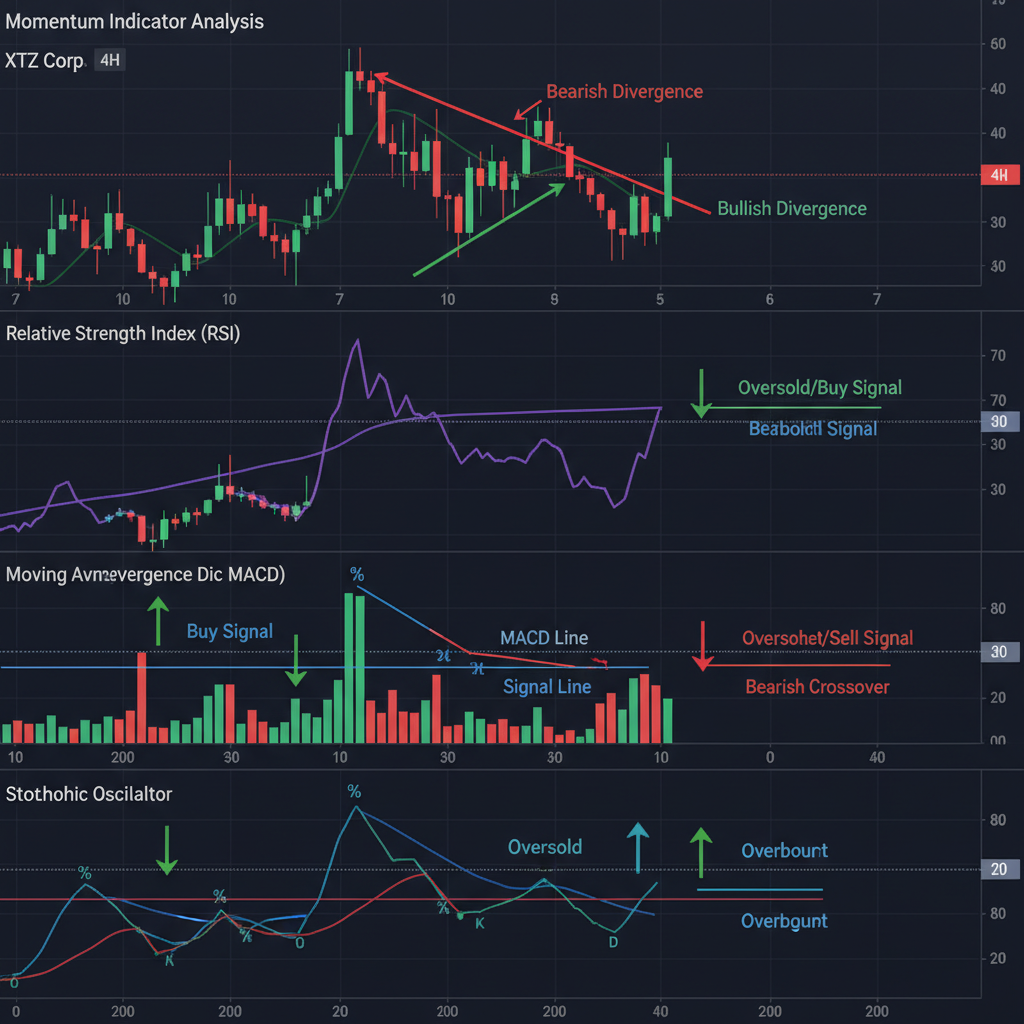
Figure 2: Trend structure showing higher highs and higher lows in an uptrend scenario
The break of trend structure often signals potential reversals or significant corrections. When an uptrend fails to create a new higher high or breaks below a significant higher low, it suggests weakening momentum. Similarly, downtrend structure breaks can indicate potential bullish reversals.
Market Structure and Institutional Levels
Market structure refers to the arrangement of price levels that institutions and large traders use for decision-making. These levels often coincide with supply and demand zones where significant buying or selling occurred in the past. Understanding market structure helps traders identify where institutional money might enter or exit positions.
Supply zones represent areas where selling pressure previously emerged, often marked by sharp price declines from consolidation areas. Demand zones show where buying interest historically appeared, typically identified by rapid price increases from accumulation regions. These zones often provide excellent trading opportunities when price returns to test them.
Psychological Round Numbers
Round numbers like 1.3000, 1.2500, or 110.00 often act as significant support or resistance levels due to psychological factors. Institutional traders frequently place orders at these levels, creating natural supply and demand zones. Understanding the significance of round numbers helps traders anticipate potential reactions and plan entries accordingly.
3. Candlestick Patterns for Price Action
Candlestick patterns form the backbone of price action analysis, providing visual representations of market sentiment and potential future price movements. These patterns reveal the battle between buyers and sellers, offering insights into market psychology that indicators cannot capture.

Figure 3: Essential candlestick patterns including Pin Bar and Engulfing patterns
Pin Bar Patterns (Hammer/Shooting Star)
Pin bars represent one of the most reliable price action patterns, characterized by small bodies and long wicks (shadows). These patterns indicate rejection of certain price levels, suggesting potential reversals or continuation moves depending on context. A pin bar at a key support level after a downtrend suggests potential bullish reversal, while one at resistance during an uptrend might indicate bearish reversal.
The key to successful pin bar trading lies in context and location. Pin bars at significant support or resistance levels carry more weight than those in the middle of trading ranges. The longer the wick relative to the body, the stronger the rejection signal. Professional traders often wait for pin bar confirmation through subsequent price action before entering trades.
Engulfing Patterns
Engulfing patterns occur when a larger candle completely encompasses the previous candle's body, indicating a shift in market sentiment. Bullish engulfing patterns show strong buying pressure overwhelming previous selling, while bearish engulfing patterns demonstrate selling pressure dominating previous buying interest.
These patterns are particularly powerful at key levels or after significant price movements. An engulfing pattern at a major support level after a prolonged downtrend can signal a strong reversal opportunity. The size and volume accompanying engulfing patterns often indicate the strength of the underlying sentiment change.
Inside Bar Patterns
Inside bars represent consolidation periods where price trades within the previous candle's range. These patterns often precede significant breakout moves as market participants await direction. Inside bars at key levels or after strong trends frequently lead to explosive moves in the breakout direction.
Trading inside bars requires patience and proper risk management. Traders typically place pending orders above and below the inside bar range, allowing the market to choose direction. The breakout direction often continues for significant distances, especially when inside bars form at crucial support or resistance levels.
Doji Patterns
Doji candles form when opening and closing prices are nearly equal, creating small bodies with upper and lower wicks. These patterns indicate market indecision and potential reversals, particularly when they appear after strong trends or at significant levels.
The effectiveness of doji patterns depends heavily on context. A doji at the end of a strong uptrend near major resistance suggests potential bearish reversal, while one at support after a downtrend might indicate bullish reversal. Multiple consecutive doji patterns often precede significant breakout moves.
4. Price Action Trading Strategies
Successful price action trading requires systematic approaches that combine pattern recognition with sound risk management. The following strategies represent time-tested methods used by professional traders to identify and capitalize on high-probability opportunities.
Support and Resistance Bounce Strategy
This strategy involves trading price reactions at established support and resistance levels. Traders look for reversal patterns like pin bars, engulfing patterns, or double bottom/top formations at these key levels. The premise is that established levels will continue to hold until definitively broken.
Entry timing is crucial for this strategy. Rather than entering immediately when price touches a level, experienced traders wait for confirmation through reversal patterns or multiple touches. Stop losses are typically placed beyond the support or resistance level, while profit targets aim for the opposite level or previous swing points.
Breakout and Retest Strategy
The breakout and retest strategy capitalizes on price movements that break through significant levels and subsequently return to test these levels as new support or resistance. This approach offers excellent risk-reward ratios and clear entry/exit criteria.
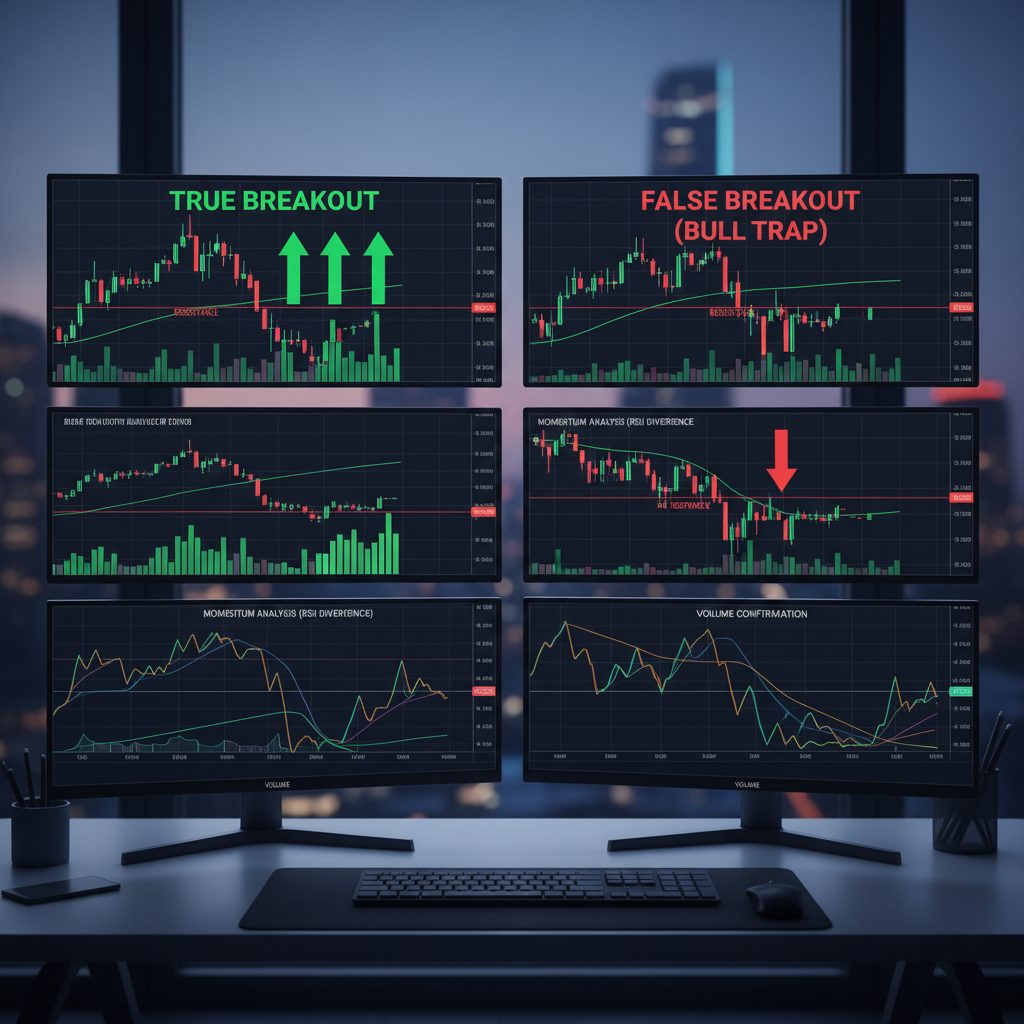
Figure 4: Breakout and retest pattern showing the classic setup and execution
The strategy requires patience as traders wait for the initial breakout, followed by a pullback to test the broken level. Entry occurs when price shows signs of rejection at the new level, often confirmed by pin bars or other reversal patterns. This approach provides tight stop losses and substantial profit potential when markets trend strongly.
Trend Continuation Strategy
Trend continuation strategies focus on trading pullbacks within established trends. The approach assumes that trends are more likely to continue than reverse, making pullbacks excellent entry opportunities for joining the dominant direction. This strategy works particularly well in strongly trending markets.
Successful trend continuation trading requires identifying the overall trend direction using higher timeframe analysis, then looking for pullback opportunities on lower timeframes. Entries occur when price shows signs of resuming the trend direction, often at moving average levels, trendlines, or Fibonacci retracement levels.
False Breakout Reversal Strategy
False breakouts occur when price briefly breaks through a significant level but quickly reverses, trapping traders who entered on the breakout. This strategy capitalizes on these failed attempts by trading the reversal back into the previous range or trend direction.
Identifying false breakouts requires understanding market context and trader psychology. Breakouts with low volume, minimal follow-through, or rapid reversal often indicate false signals. Traders enter when price clearly returns inside the previous range, targeting the opposite side while placing stops beyond the false breakout point.
5. Mastering Price Action
Developing expertise in price action trading requires dedication, systematic practice, and continuous learning. Unlike mechanical trading systems, price action mastery involves developing intuitive understanding of market behavior that comes only through extensive experience and proper training methods.
The Importance of Screen Time
Screen time represents the most crucial factor in developing price action skills. Experienced traders emphasize spending hours studying charts across different timeframes and market conditions. This observation develops pattern recognition abilities and intuitive understanding of market flow that cannot be gained through reading or automated systems.
Effective screen time involves active analysis rather than passive observation. Traders should practice identifying patterns, marking key levels, and predicting potential price movements before they occur. This exercise develops the analytical skills necessary for successful real-time decision making.
Journaling and Documentation
Maintaining detailed trading journals accelerates the learning process by providing objective feedback on trading decisions. Successful price action traders document not only their trades but also their chart analysis, pattern identification, and market observations.
Effective journals include screenshots of setups, reasoning for trade decisions, emotional state during execution, and post-trade analysis. This documentation helps identify strengths and weaknesses in analysis and execution, enabling targeted improvement efforts.
Backtesting Historical Charts
Backtesting price action strategies on historical data provides valuable practice without financial risk. This process helps traders understand strategy performance across different market conditions and refine their pattern recognition skills through extensive examples.
Manual backtesting involves reviewing historical charts and identifying trading opportunities using only information available at the time. This exercise develops the ability to make decisions under uncertainty and builds confidence in pattern recognition abilities.
Developing Pattern Recognition
Pattern recognition represents the core skill in price action trading. This ability develops through exposure to thousands of chart examples and conscious effort to identify recurring formations. Professional traders can quickly spot high-probability setups because they have seen similar patterns numerous times.
Systematic pattern study involves categorizing different formations, understanding their success rates in various contexts, and developing personal criteria for evaluating setup quality. This systematic approach transforms subjective pattern recognition into a more objective skill.
Combining with Minimal Indicators
While pure price action trading uses no indicators, many successful traders incorporate minimal indicator support for trend identification or confluence. Simple tools like moving averages for trend direction or volume for confirmation can enhance price action analysis without creating complexity.
The key is using indicators to support rather than replace price action analysis. Indicators should confirm what price action already suggests rather than providing primary trading signals. This approach maintains the benefits of price action while adding an extra layer of confirmation.
Frequently Asked Questions
Related Articles
- Scalping Strategy: The Complete Guide to Ultra-Short-Term Trading
- Day Trading Forex: Strategies, Tips, and Best Practices
- Swing Trading Forex: Complete Guide for Part-Time Traders
- Trend Trading: Riding the Wave to Consistent Profits
- Breakout Trading: Catching Big Moves Early
- Pips, Lots, and Leverage: Essential Forex Terminology
- Common Forex Trading Mistakes: 12 Critical Errors to Avoid
Comments
Post a Comment