
Moving Averages: The Ultimate Guide for Forex Traders

Why Moving Averages Are Essential for Every Forex Trader
Moving averages are the foundation of technical analysis and one of the most widely used indicators in forex trading. Whether you're a beginner learning to read charts or an experienced trader looking to refine your strategy, understanding moving averages is crucial for success in the forex market. This comprehensive guide will teach you everything you need to know about using moving averages effectively, from basic concepts to advanced trading strategies that can help you identify trends, find entry points, and manage risk.
1. What Are Moving Averages?
A moving average is a technical indicator that smooths out price data by creating a constantly updated average price over a specific time period. Think of it as a trend-following tool that helps filter out the "noise" from random price fluctuations, making it easier to identify the underlying direction of a currency pair's movement.
Moving averages work by taking the closing prices of a currency pair over a set number of periods (days, hours, or minutes) and calculating their average. As new price data becomes available, the oldest data point is dropped, and the newest one is added, causing the average to "move" across the chart.
Key Characteristics of Moving Averages
Moving averages serve several important functions in forex trading. They act as dynamic support and resistance levels, where prices often bounce off the moving average line during trends. They also provide trend identification, helping traders determine whether a currency pair is in an uptrend, downtrend, or sideways movement. Additionally, moving averages generate trading signals through crossovers and price interactions, and they help smooth price volatility, making underlying trends more visible.
Most Common Moving Average Periods
Different traders use various time periods for their moving averages, depending on their trading style and objectives. Short-term traders often use periods like 5, 10, and 20 for quick signals and scalping strategies. Medium-term traders typically employ 50 and 100-period moving averages for swing trading and daily analysis. Long-term traders rely on 200-period moving averages for major trend identification and position trading.
💡 Pro Tip: Choose Your Timeframe Wisely
The effectiveness of moving averages depends heavily on the timeframe you're trading. Day traders might use 5 and 10-period MAs on 15-minute charts, while position traders might focus on 50 and 200-period MAs on daily charts. Always align your moving average periods with your trading style and time horizon.
2. Types of Moving Averages
Not all moving averages are created equal. Each type has its own calculation method and characteristics, making them suitable for different trading scenarios. Understanding the differences between Simple Moving Averages (SMA), Exponential Moving Averages (EMA), and Weighted Moving Averages (WMA) is crucial for selecting the right tool for your trading strategy.
Simple Moving Average (SMA)
The Simple Moving Average is the most basic form of moving average. It calculates the arithmetic mean of closing prices over a specified number of periods, giving equal weight to each price point. For example, a 10-period SMA adds up the closing prices of the last 10 periods and divides by 10.
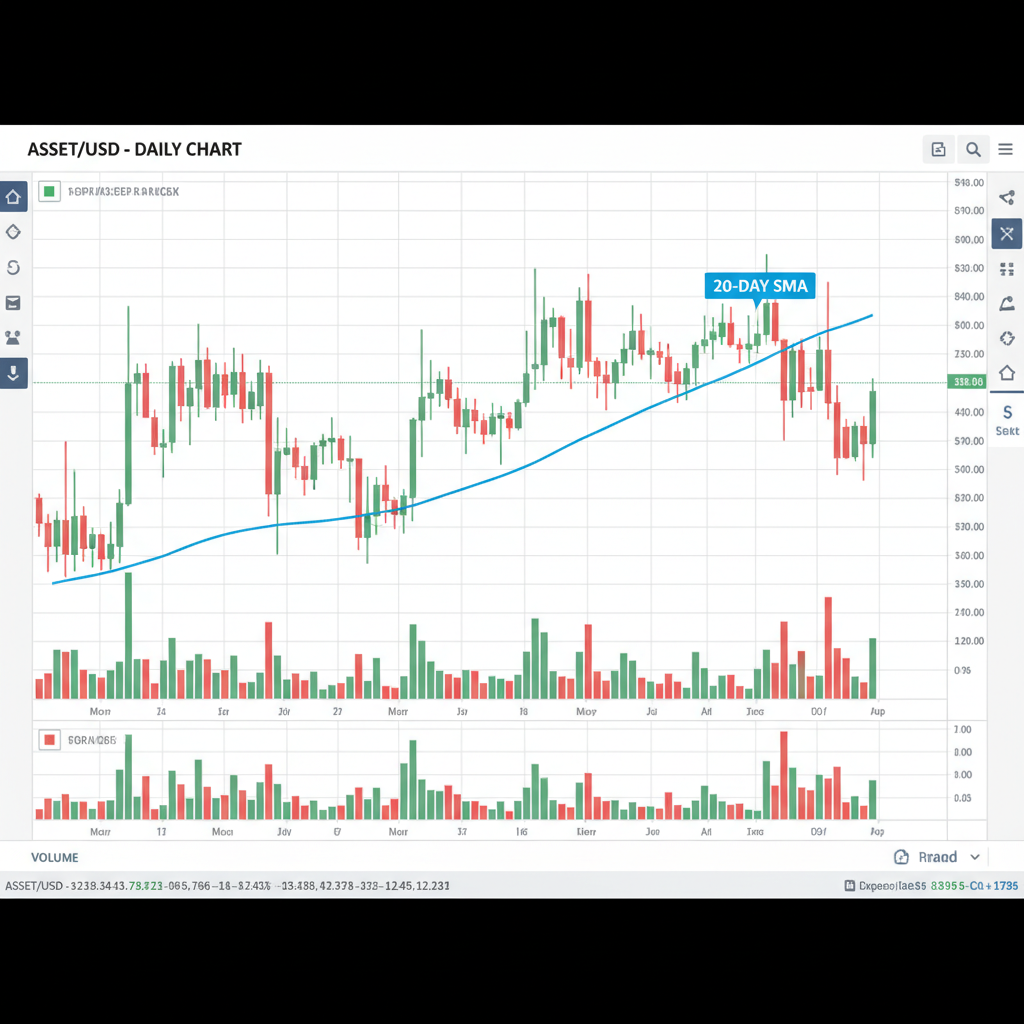
SMAs are excellent for identifying long-term trends and providing stable support and resistance levels. They're less prone to whipsaws (false signals) because they react more slowly to price changes. However, this slower reaction can also mean missing early entry opportunities in fast-moving markets.
Exponential Moving Average (EMA)
The Exponential Moving Average gives more weight to recent prices, making it more responsive to current market conditions. The EMA calculation uses a smoothing factor (multiplier) that emphasizes the latest price data while still considering historical prices, but with decreasing influence.
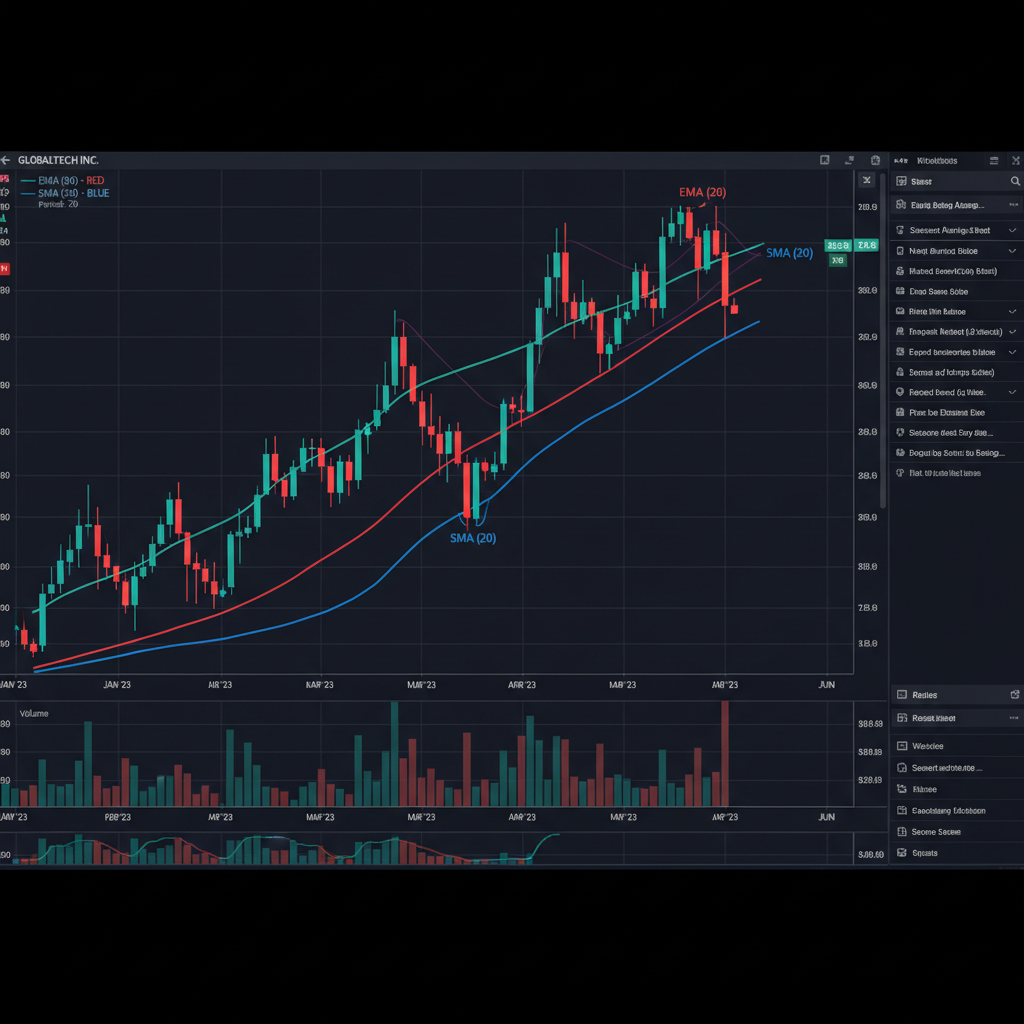
EMAs are preferred by active traders because they provide earlier signals for trend changes and reversals. They stick closer to current prices, making them ideal for short-term trading strategies. However, this sensitivity can also lead to more false signals in choppy, sideways markets.
Weighted Moving Average (WMA)
The Weighted Moving Average assigns different weights to each price point, with the most recent prices receiving the highest weight and older prices receiving progressively lower weights. The calculation involves multiplying each price by its weight factor and then dividing by the sum of all weights.
WMAs offer a middle ground between SMAs and EMAs, being more responsive than SMAs but less sensitive than EMAs. They're useful for traders who want some responsiveness to recent price action without the extreme sensitivity of EMAs.
| Feature | Simple MA (SMA) | Exponential MA (EMA) | Weighted MA (WMA) |
|---|---|---|---|
| Calculation | Equal weight to all periods | More weight to recent data | Linear weight decrease |
| Responsiveness | Slow to react | Quick to react | Moderate reaction |
| Stability | Most stable | Least stable | Moderately stable |
| Best for | Long-term trends | Short-term signals | Medium-term analysis |
| False signals | Fewer false signals | More false signals | Moderate false signals |
| Popular periods | 50, 100, 200 | 12, 26, 50 | 20, 50, 100 |
✅ Advantages of Each Type
SMA: Reliable trend identification, fewer whipsaws, excellent for major support/resistance levels
EMA: Early signal generation, responsive to market changes, great for active trading
WMA: Balanced approach, customizable weighting, good for medium-term strategies
❌ Disadvantages to Consider
SMA: Slow signal generation, may miss early opportunities, lagging indicator
EMA: Prone to false signals, can be overly sensitive in ranging markets
WMA: More complex calculation, less commonly used, limited platform support
3. Moving Average Trading Strategies
Moving averages become powerful trading tools when incorporated into systematic strategies. The following five strategies represent some of the most effective ways to use moving averages in forex trading, each suited to different market conditions and trading styles.
Strategy #1: Single MA as Dynamic Support/Resistance
This foundational strategy uses a single moving average as a dynamic level of support in uptrends and resistance in downtrends. The 50-period EMA is particularly popular for this approach on daily charts.
Entry Rules:
- In an uptrend: Buy when price pulls back to and bounces off the moving average
- In a downtrend: Sell when price rallies to and rejects from the moving average
- Confirm trend direction using higher timeframes
Risk Management: Place stop loss 20-30 pips below the moving average for longs, or 20-30 pips above for shorts. Target profits at 2:1 or 3:1 risk-reward ratio.
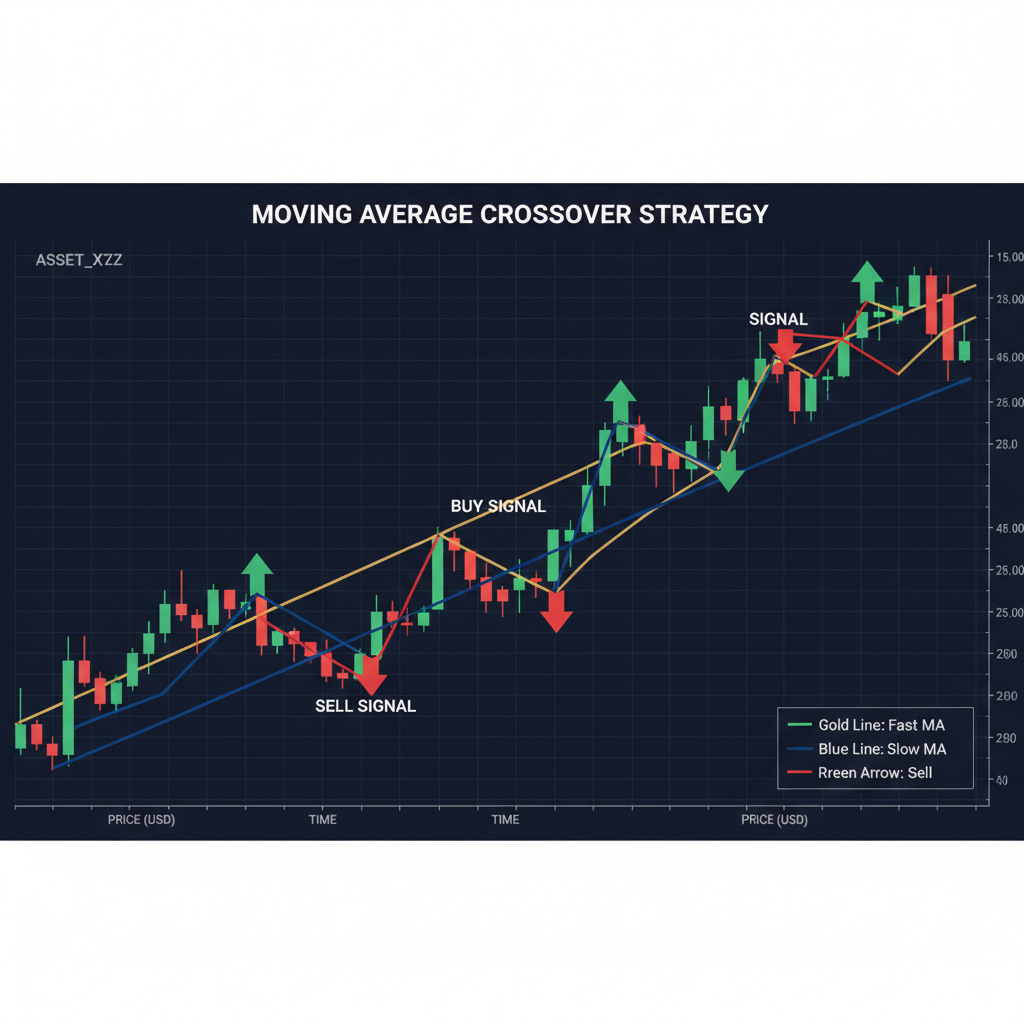
Strategy #2: Moving Average Crossover
The classic crossover strategy uses two moving averages of different periods. When the faster MA crosses above the slower MA, it generates a buy signal. When it crosses below, it generates a sell signal.
Popular Combinations:
- 10 EMA and 20 EMA (short-term trading)
- 20 EMA and 50 EMA (medium-term trading)
- 50 SMA and 200 SMA (long-term trading)
Entry Rules: Enter long when fast MA crosses above slow MA with confirming volume. Enter short when fast MA crosses below slow MA. Wait for candle close to confirm the crossover.
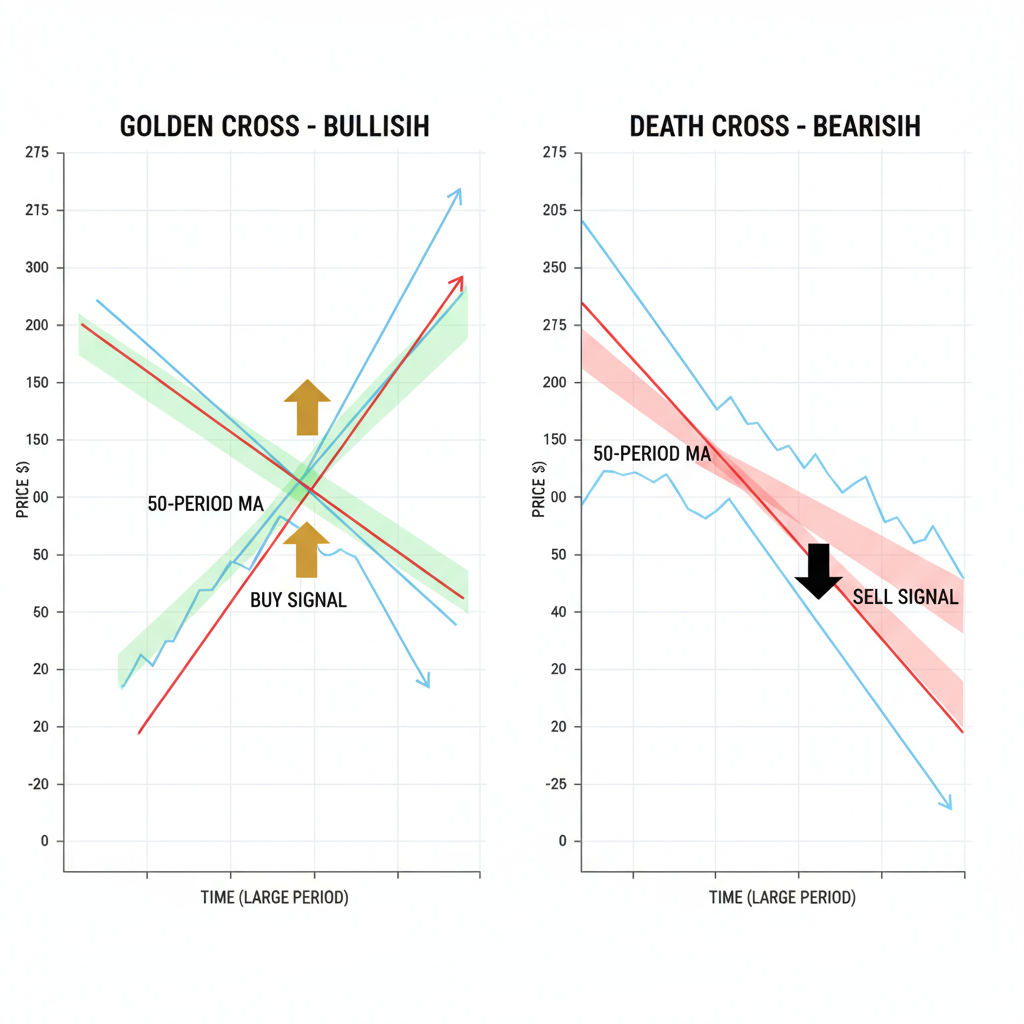
Strategy #3: Golden Cross and Death Cross
These are special cases of the crossover strategy using the 50-period and 200-period moving averages. The Golden Cross (50 MA crossing above 200 MA) signals a potential major uptrend, while the Death Cross (50 MA crossing below 200 MA) indicates a potential major downtrend.
Application: These signals are most effective on daily and weekly charts for major currency pairs. They often coincide with significant market shifts and can provide high-probability, long-term trading opportunities.
Confirmation: Look for increasing trading volume and fundamental factors supporting the direction of the cross.
Strategy #4: Triple Moving Average System
This advanced strategy uses three EMAs: 10, 20, and 50 periods. It provides multiple layers of trend confirmation and helps filter out false signals.
Bullish Setup: 10 EMA > 20 EMA > 50 EMA (all aligned upward)
Bearish Setup: 10 EMA < 20 EMA < 50 EMA (all aligned downward)
Entry Rules: Only take trades when all three MAs are properly aligned. Enter on pullbacks to the 20 EMA in trending markets. Exit when the alignment breaks down.
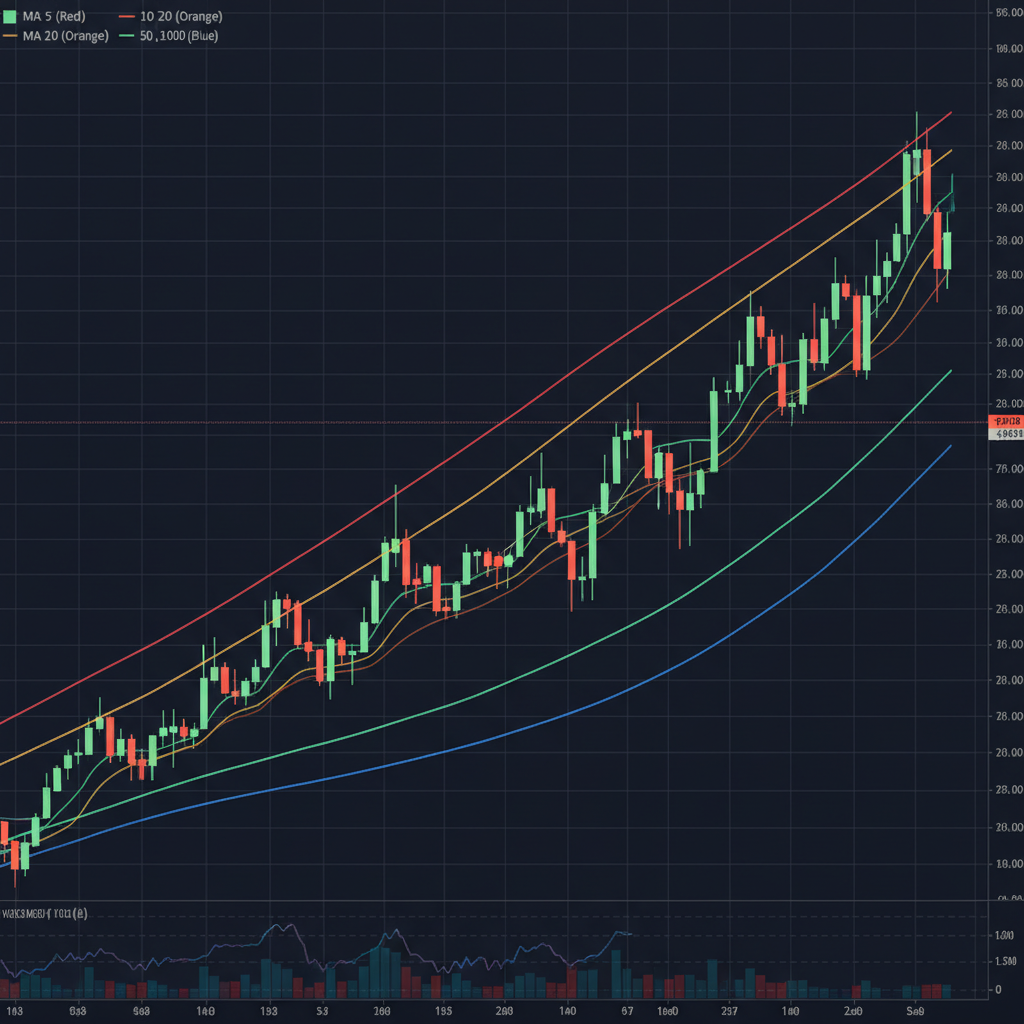
Strategy #5: Moving Average Ribbon
This strategy uses multiple moving averages (typically 8-12 different periods) to create a "ribbon" effect. When all MAs are expanding and aligned in one direction, it indicates a strong trend. When they're compressed and tangled, it suggests consolidation.
Common Ribbon Setup: 5, 8, 13, 21, 34, 55, 89 EMAs (Fibonacci sequence)
Trading Rules: Trade in the direction of ribbon expansion. Avoid trading when the ribbon is compressed. Use the ribbon as dynamic support/resistance zones.
⚠️ Important Strategy Considerations
Remember that moving averages are lagging indicators, meaning they react to price changes rather than predict them. Always combine MA strategies with proper risk management and consider the overall market context. In ranging, sideways markets, moving averages can generate numerous false signals, so it's crucial to identify the market environment before applying these strategies.
4. Combining Moving Averages with Other Tools
While moving averages are powerful on their own, their effectiveness increases significantly when combined with other technical indicators and analysis methods. This multi-layered approach helps confirm signals, reduce false entries, and improve overall trading accuracy.
Moving Averages + RSI (Relative Strength Index)
The RSI helps identify overbought and oversold conditions, making it an excellent complement to moving average strategies. When price is above a moving average and RSI shows oversold conditions (below 30), it can signal a potential buying opportunity in an uptrend. Conversely, when price is below a moving average and RSI shows overbought conditions (above 70), it may indicate a selling opportunity in a downtrend.
A popular combination is using the 50 EMA with a 14-period RSI. Enter long positions when price bounces off the 50 EMA from above AND RSI shows oversold readings. Enter short positions when price rejects from the 50 EMA from below AND RSI shows overbought readings.
Moving Averages + MACD
The MACD (Moving Average Convergence Divergence) is itself based on moving averages, making it a natural complement to MA strategies. The MACD can provide early warning signals for potential moving average crossovers and help confirm trend strength.
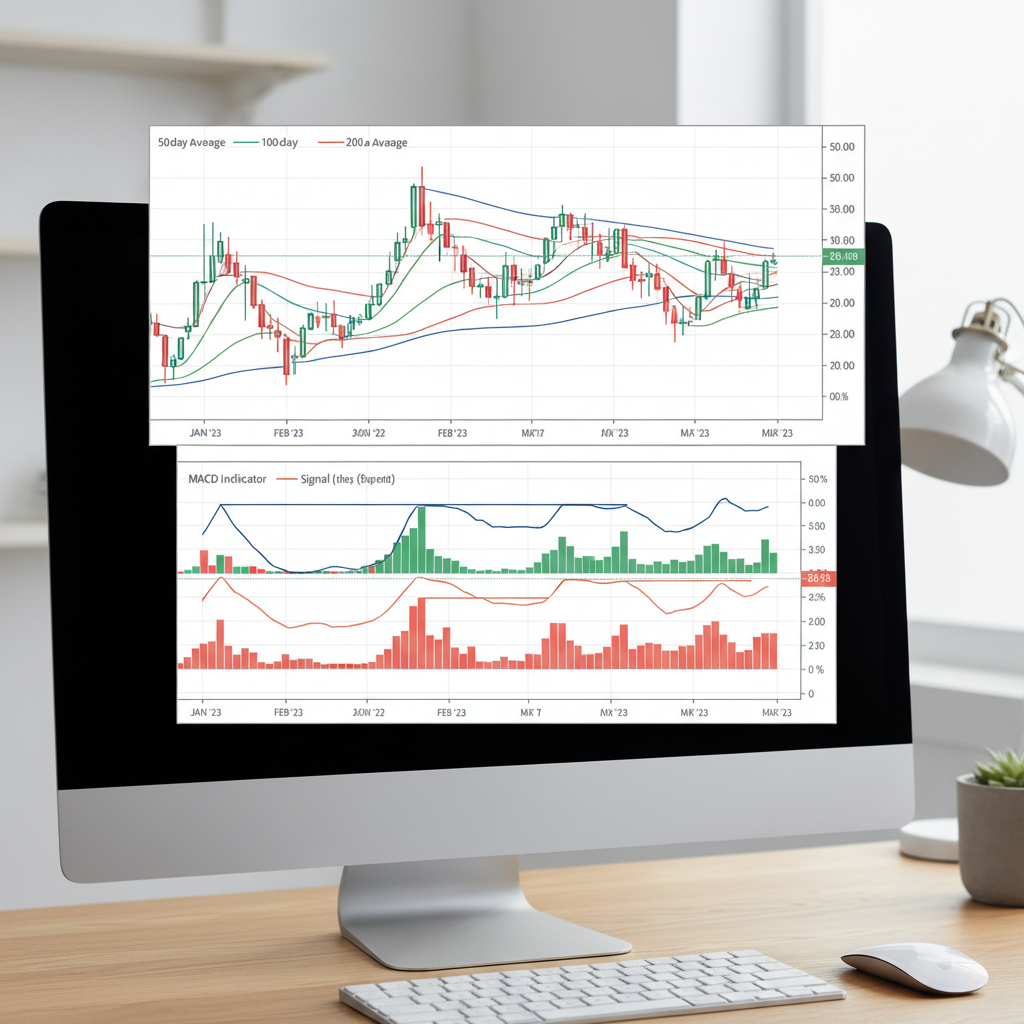
Look for convergence between MACD signals and moving average crossovers. When the MACD line crosses above the signal line while the fast MA crosses above the slow MA, it provides strong bullish confirmation. The opposite scenario provides strong bearish confirmation.
Moving Averages + Support and Resistance
Combining moving averages with traditional support and resistance levels creates powerful confluence zones. When a moving average aligns with a significant support or resistance level, it strengthens that level's importance and increases the probability of a reaction.
Pay special attention when the 200-period MA coincides with major psychological levels (like 1.2000 for EUR/USD) or previous significant highs and lows. These confluence areas often provide the best risk-reward trading opportunities.
Moving Averages + Bollinger Bands
Bollinger Bands use a moving average (typically 20-period SMA) as their centerline, with upper and lower bands based on standard deviations. This combination helps identify when prices are overextended from their moving average.
Trade mean reversion when price touches the outer Bollinger Bands and shows signs of returning to the moving average. Trade breakouts when price moves decisively beyond the bands with strong momentum and volume.
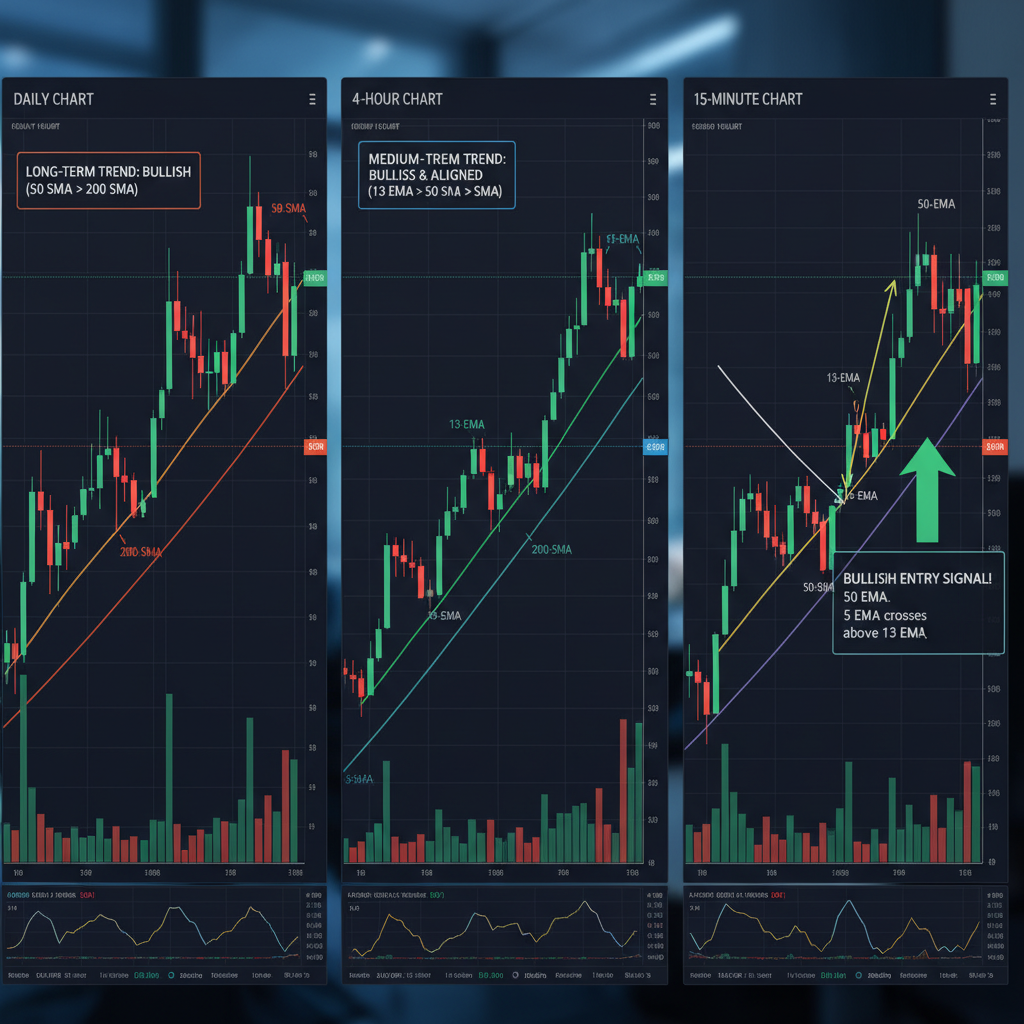
💡 Multi-Timeframe Analysis
Use moving averages across multiple timeframes for stronger signal confirmation. For example, if you're day trading on 15-minute charts, check that the 1-hour and 4-hour charts also show moving averages aligned in your intended trade direction. This top-down analysis significantly improves trade quality.
5. Common Moving Average Mistakes
Even experienced traders can fall into moving average traps that lead to losses. Understanding and avoiding these common mistakes is crucial for successful implementation of moving average strategies.
Mistake #1: Using Moving Averages in Ranging Markets
The biggest mistake traders make is applying moving average strategies during sideways, choppy market conditions. Moving averages work best in trending markets and can generate numerous false signals when prices are ranging. Before implementing any MA strategy, first identify whether the market is trending or ranging.
Solution: Use trend identification tools like ADX (Average Directional Index) to determine market conditions. Only apply moving average strategies when the market shows clear directional bias.
Mistake #2: Over-Optimizing Moving Average Periods
Many traders spend excessive time trying to find the "perfect" moving average periods for their strategy. This over-optimization often leads to curve-fitting, where the strategy works well on historical data but fails in real market conditions.
Solution: Stick to commonly used periods (10, 20, 50, 100, 200) that are watched by many market participants. These levels tend to be more reliable because they become self-fulfilling prophecies.
Mistake #3: Ignoring Market Context
Blindly following moving average signals without considering broader market context is a recipe for losses. Economic events, central bank announcements, and geopolitical developments can override technical signals.
Solution: Always check the economic calendar and be aware of upcoming high-impact news events. Avoid taking new positions immediately before major announcements that could cause significant volatility.
Mistake #4: Poor Risk Management
Many traders focus so much on entry signals that they neglect proper risk management. Moving average strategies, like all trading approaches, require strict stop losses and position sizing rules.
Solution: Never risk more than 1-2% of your account on any single trade. Place stop losses beyond significant moving average levels and stick to predetermined risk-reward ratios.
Mistake #5: Chasing Every Crossover
Novice traders often try to trade every moving average crossover, leading to overtrading and increased transaction costs. Not all crossovers are created equal, and quality is more important than quantity.
Solution: Be selective with your trades. Wait for crossovers that occur near significant support/resistance levels, have good risk-reward ratios, and align with the broader market trend.
⚠️ The Lagging Indicator Challenge
Remember that all moving averages are lagging indicators. They tell you what has happened, not what will happen. This inherent lag means you'll never catch the exact top or bottom of a move. Accept this limitation and focus on catching the middle portion of trends, which is where the real money is made.
📚 Continue Your Forex Education
Expand your technical analysis knowledge with these related articles:
Frequently Asked Questions
Risk Disclaimer
Forex trading involves substantial risk and may not be suitable for all investors. Past performance is not indicative of future results. The high degree of leverage can work against you as well as for you. Before deciding to trade foreign exchange, you should carefully consider your investment objectives, level of experience, and risk appetite. You could lose some or all of your initial investment; therefore, you should not invest money that you cannot afford to lose. Always conduct your own research and consider seeking advice from independent financial advisors.
Comments
Post a Comment