
MACD Indicator: Complete Trading Guide with Examples
What is MACD?
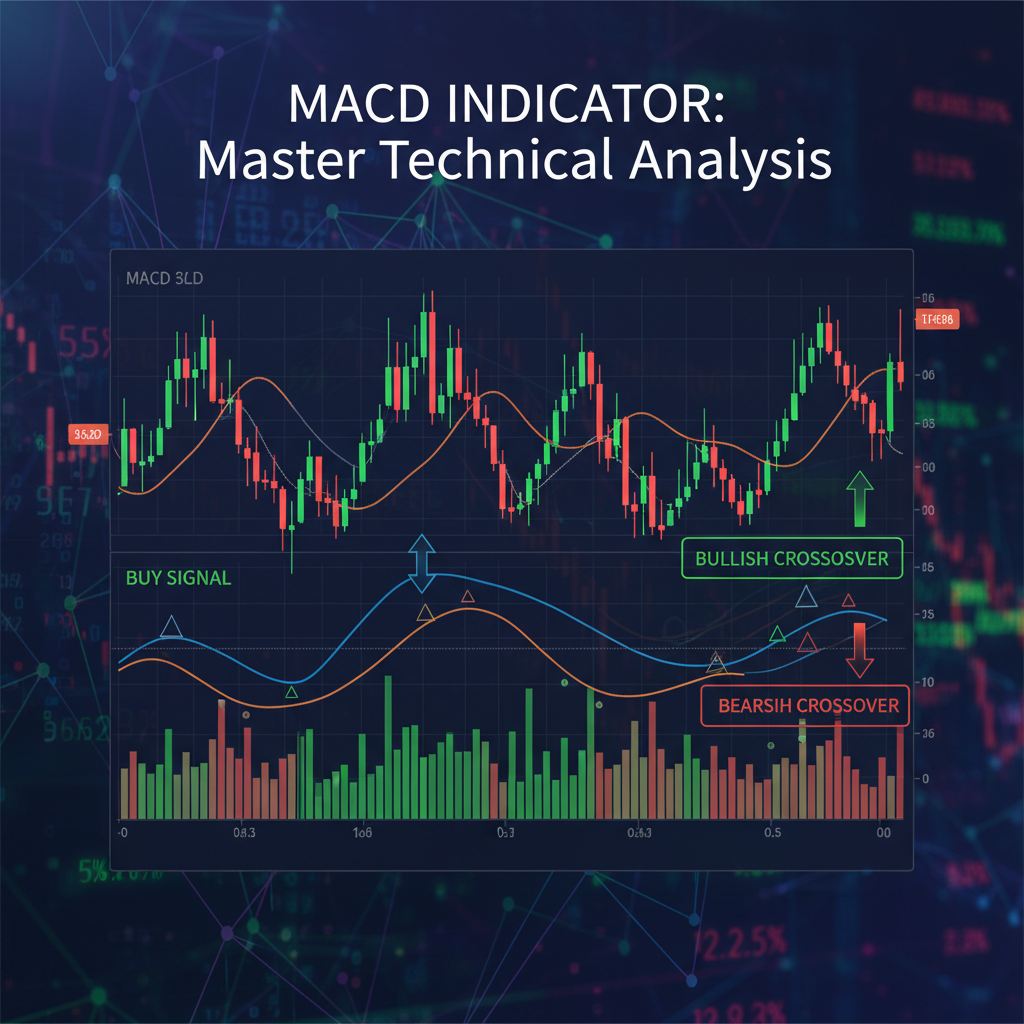
MACD stands for Moving Average Convergence Divergence, which describes exactly what this indicator does - it measures the convergence and divergence of two exponential moving averages. MACD is both a trend-following and momentum oscillator that helps traders identify trend direction, momentum shifts, and potential trading opportunities.
The Three Components of MACD

MACD Line
Difference between 12-period EMA and 26-period EMA
Signal Line
9-period EMA of the MACD line
Histogram
Distance between MACD line and Signal line
Standard MACD Settings
The default MACD settings are 12, 26, 9, which means:
- 12: Fast-moving average period (12-period EMA)
- 26: Slow-moving average period (26-period EMA)
- 9: Signal line period (9-period EMA of MACD line)
What MACD Measures
MACD measures two key market characteristics:
- Trend Direction: When MACD is above the zero line, it indicates an uptrend. When below, it suggests a downtrend.
- Momentum: The distance between the MACD line and signal line shows the strength of the current move.
Reading MACD Components
The MACD Line
The MACD line is calculated by subtracting the 26-period exponential moving average (EMA) from the 12-period EMA. This line oscillates above and below the zero line and represents the difference in momentum between these two moving averages.
| MACD Line Position | Market Condition | Interpretation |
|---|---|---|
| Above Zero Line | Bullish Trend | 12 EMA > 26 EMA, upward momentum |
| Below Zero Line | Bearish Trend | 12 EMA < 26 EMA, downward momentum |
| Rising | Increasing Momentum | Trend is strengthening |
| Falling | Decreasing Momentum | Trend is weakening |
The Signal Line
The signal line is a 9-period EMA of the MACD line itself. It acts as a trigger for buy and sell signals when the MACD line crosses above or below it. The signal line smooths out the MACD line movements and helps filter out false signals.
The MACD Histogram
The histogram represents the distance between the MACD line and the signal line. It's calculated by subtracting the signal line value from the MACD line value. The histogram provides early warning signals of potential crossovers.
- Positive Histogram: MACD line is above signal line (bullish momentum)
- Negative Histogram: MACD line is below signal line (bearish momentum)
- Increasing Histogram: Gap between lines is widening (momentum accelerating)
- Decreasing Histogram: Gap between lines is narrowing (momentum slowing)
Zero Line Significance
The zero line in MACD is crucial because it represents the point where the 12-period EMA equals the 26-period EMA. Crossovers of this line indicate significant trend changes:
When MACD crosses above the zero line, it suggests the beginning of a bullish trend. When it crosses below, it indicates the start of a bearish trend.
MACD Trading Strategies
1. MACD Crossover Strategy
Signal Line Crossover
Buy Signal: MACD line crosses above the signal line
Sell Signal: MACD line crosses below the signal line
Best For: Trending markets with clear momentum
Entry Rules:
- Wait for a clear crossover (not just a touch)
- Confirm with price action and trend direction
- Use higher timeframes for confirmation
Example: On EUR/USD 4-hour chart, when MACD line crosses above the signal line while both are below zero, it could signal a potential bullish reversal. However, wait for additional confirmation before entering.
2. Zero Line Crossover Strategy
Zero Line Cross
Buy Signal: MACD line crosses above zero line
Sell Signal: MACD line crosses below zero line
Best For: Identifying major trend changes
Entry Rules:
- Enter when MACD confirms zero line break
- Use with trend-following strategies
- Combine with support/resistance levels
3. MACD Divergence Strategy
Bullish and Bearish Divergence
Bullish Divergence: Price makes lower lows while MACD makes higher lows
Bearish Divergence: Price makes higher highs while MACD makes lower highs
Best For: Identifying potential trend reversals
Entry Rules:
- Wait for divergence to complete
- Look for additional reversal confirmation
- Use with key support/resistance levels
4. Histogram Reversal Strategy
Momentum Shift Detection
Buy Signal: Histogram stops decreasing and starts increasing (momentum shift)
Sell Signal: Histogram stops increasing and starts decreasing
Best For: Early entry into trend continuations or reversals
Entry Rules:
- Wait for 2-3 bars of histogram change
- Confirm with overall trend direction
- Use tight stop losses due to early entry
5. MACD as Trend Filter
Trend Direction Filter
Bullish Bias: Only take long trades when MACD is above zero
Bearish Bias: Only take short trades when MACD is below zero
Best For: Filtering trades in the direction of the major trend
Application:
- Use with other entry strategies
- Helps avoid counter-trend trades
- Improves overall win rate
MACD Settings and Customization
Standard vs. Fast MACD Settings
| MACD Type | Settings | Sensitivity | Best For |
|---|---|---|---|
| Standard MACD | 12, 26, 9 | Medium | Swing trading, daily charts |
| Fast MACD | 5, 35, 5 | High | Day trading, shorter timeframes |
| Slow MACD | 19, 39, 9 | Low | Position trading, weekly charts |
| Conservative MACD | 8, 21, 5 | Medium-High | Balanced approach |
Adjusting for Different Timeframes
- 1-5 minute charts: Use faster settings (5, 13, 4) for quick signals
- 15-30 minute charts: Standard settings (12, 26, 9) work well
- 1-4 hour charts: Standard settings or slightly slower (12, 26, 9)
- Daily charts: Standard settings or conservative approach
- Weekly charts: Use slower settings (19, 39, 9) for major trends
Day Trading vs. Swing Trading Settings
Day Trading MACD Settings:
- Fast settings for quick entries: (5, 35, 5) or (8, 21, 5)
- Use on 5-15 minute charts
- Focus on signal line crossovers
- Quick profit-taking and tight stops
Swing Trading MACD Settings:
- Standard settings for reliable signals: (12, 26, 9)
- Use on 4-hour to daily charts
- Focus on zero line crossovers and divergences
- Allow more room for market fluctuations
Multiple MACD Systems
Testing Optimal Settings
To find the best MACD settings for your trading style:
- Backtest Different Settings: Test various parameter combinations on historical data
- Consider Market Conditions: Trending vs. ranging markets may require different settings
- Match Your Timeframe: Align MACD sensitivity with your trading timeframe
- Forward Test: Demo trade with your chosen settings before using real money
MACD Limitations and Best Practices
Understanding MACD Limitations
- Lagging Nature: MACD is based on moving averages, so signals come after price moves
- False Signals in Ranging Markets: Produces many whipsaws when markets lack clear direction
- Sensitivity Issues: Too sensitive settings create noise; too slow settings miss opportunities
- No Price Levels: MACD doesn't provide specific price targets or stop loss levels
Best Practices for MACD Trading
1. Combine with Other Indicators
MACD works best when combined with other technical tools:
- Support and Resistance: Use key levels to filter MACD signals
- RSI: Combine with RSI indicator for overbought/oversold confirmation
- Moving Averages: Use moving averages for trend direction confirmation
- Volume: Confirm signals with volume analysis when available
2. Multiple Timeframe Confirmation
3. Risk Management with MACD
Proper risk management is crucial when trading MACD signals:
- Stop Loss Placement: Place stops beyond recent swing highs/lows, not just based on MACD
- Position Sizing: Risk no more than 1-2% of account per trade
- Take Profit Targets: Use technical levels, not just opposite MACD signals
- Maximum Exposure: Limit total MACD-based positions to avoid overconcentration
4. Market Condition Awareness
Adjust your MACD strategy based on market conditions:
- Trending Markets: Focus on zero line crossovers and trend-following signals
- Ranging Markets: Look for divergences and be more selective with entries
- High Volatility: Use wider stops and be prepared for more false signals
- Low Volatility: Tighten parameters and look for breakout confirmations
5. Patience and Discipline
Frequently Asked Questions About MACD
What are the best MACD settings for forex trading?
The default MACD settings (12, 26, 9) work well for most forex trading scenarios. For day trading, consider faster settings like (5, 35, 5), while swing traders can stick with standard settings. The key is to match the sensitivity to your trading timeframe and style.
How do you read MACD crossover signals?
A bullish crossover occurs when the MACD line crosses above the signal line, suggesting upward momentum. A bearish crossover happens when the MACD line crosses below the signal line, indicating downward momentum. Always confirm crossovers with trend direction and other technical analysis.
What is MACD divergence and how do you trade it?
MACD divergence occurs when price and MACD move in opposite directions. Bullish divergence (price makes lower lows while MACD makes higher lows) suggests potential upward reversal. Bearish divergence (price makes higher highs while MACD makes lower highs) indicates potential downward reversal. Wait for additional confirmation before trading divergences.
Can MACD be used for day trading?
Yes, MACD can be effective for day trading when using faster settings and shorter timeframes. Use settings like (5, 35, 5) on 5-15 minute charts for quicker signals. Focus on signal line crossovers and combine with support/resistance levels for better entries.
What timeframe is best for MACD trading?
MACD works on all timeframes, but 4-hour and daily charts provide the most reliable signals. For day trading, use 15-30 minute charts. For swing trading, 4-hour to daily charts are optimal. Higher timeframes reduce false signals but provide fewer trading opportunities.
How do you avoid false MACD signals?
To reduce false MACD signals: 1) Use multiple timeframe confirmation, 2) Combine with support/resistance levels, 3) Wait for clear crossovers rather than quick touches, 4) Avoid trading during low-volatility ranging periods, 5) Use additional indicators like RSI for confirmation.
What's the difference between MACD and RSI indicators?
MACD is a trend-following momentum indicator that shows the relationship between two moving averages, while RSI is a bounded oscillator (0-100) that measures overbought/oversold conditions. MACD is better for trend identification and momentum, while RSI excels at finding reversal points in ranging markets.
Should you use MACD alone or with other indicators?
MACD should be combined with other technical analysis tools for best results. Use it with support/resistance levels, moving averages, RSI, or price action patterns. This multi-indicator approach helps filter false signals and increases the probability of successful trades.
Related Articles
- Technical Analysis for Beginners: Reading Forex Charts
- Moving Averages: The Ultimate Guide for Forex Traders
- RSI Indicator: How to Use Relative Strength Index in Forex
- Trend Trading: Riding the Wave to Consistent Profits
- Price Action Trading: Reading the Market Without Indicators
Risk Disclaimer
Trading Involves Substantial Risk: Forex trading involves substantial risk of loss and is not suitable for all investors. Past performance is not indicative of future results. The high degree of leverage can work against you as well as for you. Before deciding to trade foreign exchange, you should carefully consider your investment objectives, level of experience, and risk appetite.
Educational Content Only: This article is for educational purposes only and does not constitute investment advice. The information provided should not be considered as a recommendation to buy or sell any particular currency pair or financial instrument. Always conduct your own research and consider seeking advice from an independent financial advisor.
No Guarantee of Profits: No trading system or methodology has ever been developed that can guarantee profits or ensure freedom from losses. Any claims of profitability or specific performance results should be viewed with skepticism. All trading involves risk, and losses can exceed deposits.
Demo Trading Recommended: Before implementing any trading strategy with real money, thoroughly test it using a demo account to understand how the strategy performs in different market conditions. Demo trading cannot perfectly simulate the emotional and psychological aspects of live trading.
Comments
Post a Comment