
Candlestick Patterns Every Forex Trader Must Know
1. Introduction to Candlestick Patterns
The History: From Rice Trading to Modern Forex
Candlestick charting was invented in the 1700s by Munehisa Homma, a legendary Japanese rice trader who dominated the rice markets and amassed enormous wealth. His methods were refined over centuries and introduced to the Western world by Steve Nison in his 1991 book "Japanese Candlestick Charting Techniques."
Today, candlestick patterns are used by millions of traders worldwide across all markets—stocks, forex, commodities, and cryptocurrencies. Their enduring popularity stems from their visual clarity and psychological insight into market dynamics.
Anatomy of a Candlestick
Understanding candlestick structure is fundamental before learning patterns:
- Body: The thick rectangular part showing the range between opening and closing prices
- Upper Wick (Shadow): The thin line above the body, showing the highest price reached
- Lower Wick (Shadow): The thin line below the body, showing the lowest price reached
- Open: The price at which the period started
- Close: The price at which the period ended
- High: The highest price during the period
- Low: The lowest price during the period
Bullish vs. Bearish Candles
- Bullish Candle (Green/White): Close price > Open price. Shows buying pressure dominated the period.
- Bearish Candle (Red/Black): Close price < Open price. Shows selling pressure dominated the period.
Why Patterns Matter: Market Psychology
Candlestick patterns work because they reveal the psychological battle between bulls (buyers) and bears (sellers):
- Long Bullish Body: Strong buying pressure, bulls in control
- Long Bearish Body: Strong selling pressure, bears in control
- Small Body: Indecision, equilibrium between buyers and sellers
- Long Upper Wick: Buyers tried to push higher but were rejected
- Long Lower Wick: Sellers pushed lower but buyers stepped in
2. Single Candlestick Patterns
Single candlestick patterns form from just one candle and can provide powerful trading signals when they appear at key levels.
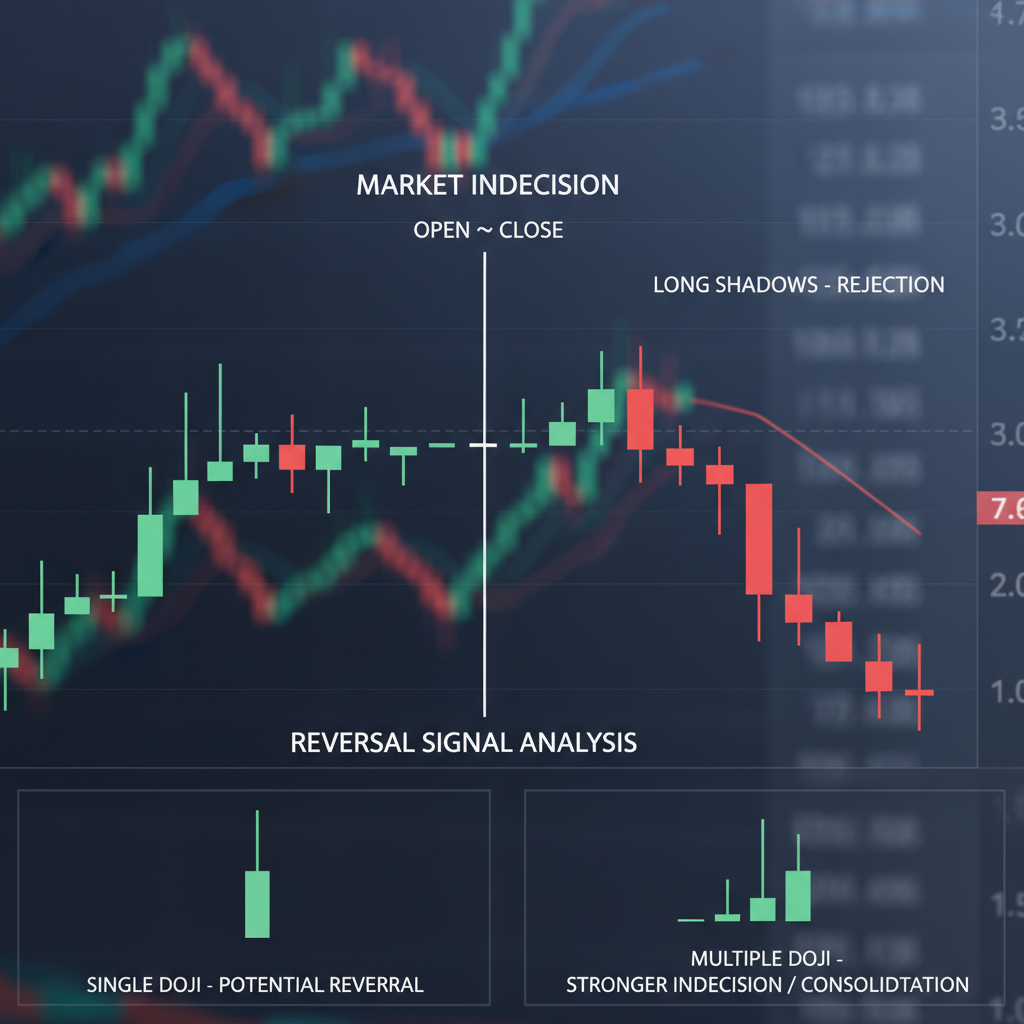
🕯️ Doji: The Indecision Candle
Formation: Open and close prices are virtually identical, creating a cross or plus sign shape.
Psychology: Perfect balance between buyers and sellers. After a strong trend, it signals potential exhaustion and reversal.
Types of Doji:
- Standard Doji: Small body with wicks of similar length. Indicates indecision.
- Dragonfly Doji: Long lower wick, no upper wick. Strong bullish signal when at support.
- Gravestone Doji: Long upper wick, no lower wick. Strong bearish signal when at resistance.
- Long-Legged Doji: Very long wicks both directions. Extreme indecision and volatility.
Trading Rules:
- Doji after uptrend at resistance → Consider selling
- Doji after downtrend at support → Consider buying
- Always wait for confirmation in the next 1-2 candles
- Doji in sideways market has little significance
🔨 Hammer and Hanging Man
Formation: Small body at the top of the candle with a long lower wick (at least 2x the body length). Little to no upper wick.
Psychology: Sellers pushed price down significantly, but buyers stepped in forcefully and pushed price back up near the opening level.
Hammer (Bullish):
- Appears at the bottom of a downtrend or at support
- Can be green or red (green is stronger)
- Signals potential reversal to the upside
- Reliability increases with longer lower wick and confirmation
Hanging Man (Bearish):
- Identical shape to hammer but appears at the top of an uptrend
- Suggests buyers are losing control despite pushing price up initially
- Needs bearish confirmation candle to validate
Trading Example - EUR/USD:
Price drops from 1.1000 to 1.0850 in a downtrend. At 1.0850, a hammer forms: opens at 1.0860, drops to 1.0840, closes at 1.0858. Long lower wick shows strong rejection. Next candle closes green at 1.0880. Signal confirmed—enter long with stop at 1.0835.
⭐ Shooting Star and Inverted Hammer
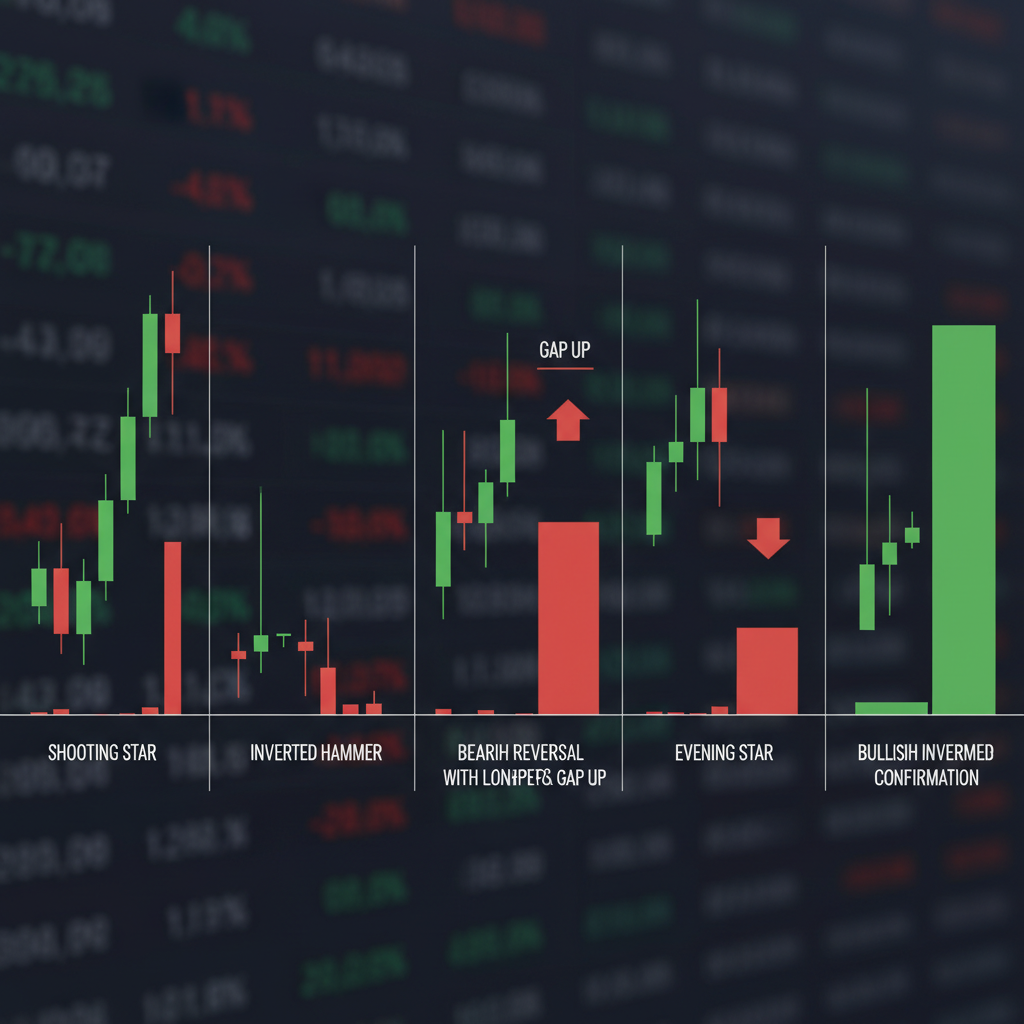
Formation: Small body at the bottom with a long upper wick (at least 2x the body). Little to no lower wick.
Shooting Star (Bearish):
- Appears at the top of an uptrend or at resistance
- Buyers pushed price higher but sellers overwhelmed them
- Strong rejection of higher prices
- Bearish reversal signal, especially with confirmation
Inverted Hammer (Bullish):
- Identical to shooting star but appears at the bottom of downtrend
- Shows buyers attempting to take control
- Requires bullish confirmation candle
- Often precedes strong upward moves
🌀 Spinning Top
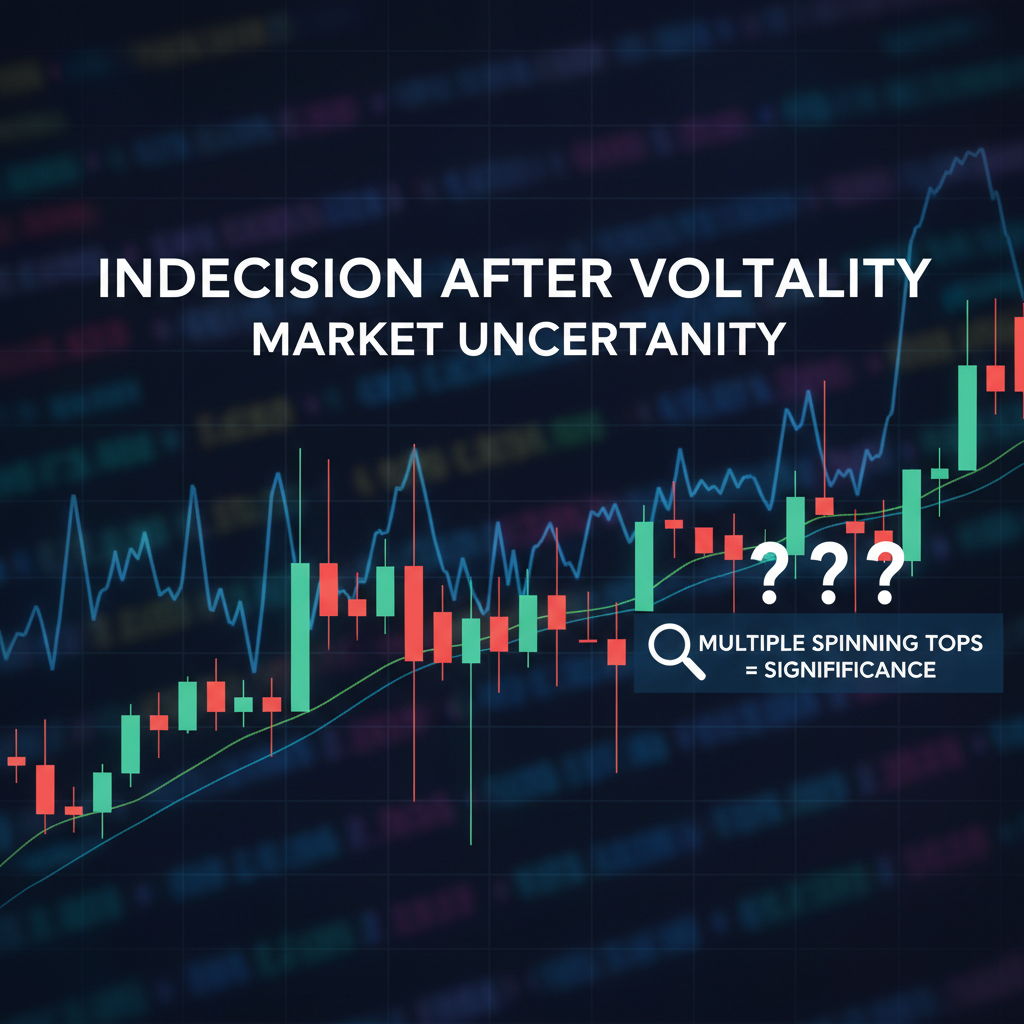
Formation: Small body (either color) with upper and lower wicks of similar length.
Psychology: High volatility but indecision. Neither bulls nor bears could gain control.
Significance:
- After strong trend → Potential weakening of momentum
- Multiple spinning tops → Market consolidation
- Less reliable than other single patterns
- Best used with other indicators
📏 Marubozu: The Strong Directional Candle
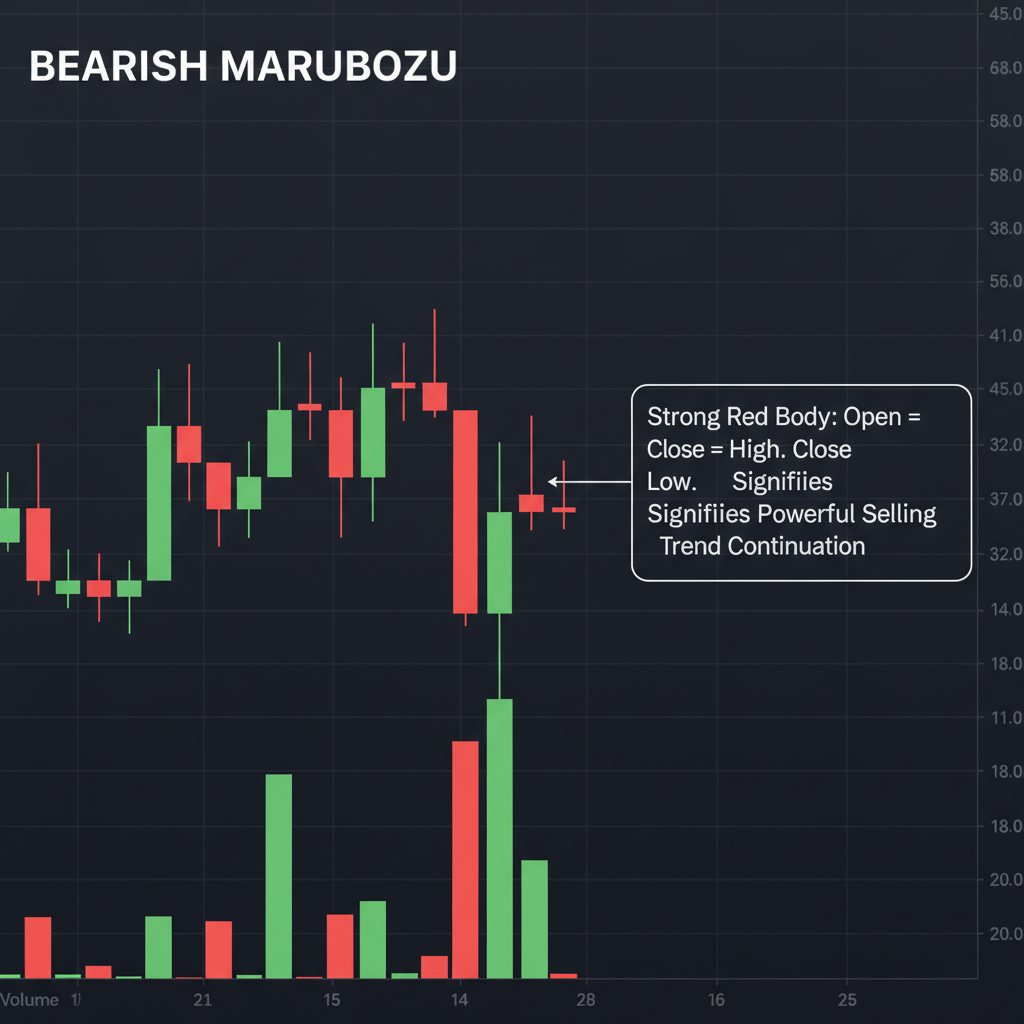
Formation: Large body with little to no wicks on either end. The candle opens at one extreme and closes at the other extreme.
Bullish Marubozu:
- Opens at/near low, closes at/near high
- No upper or lower wick (or very small)
- Shows complete buying dominance
- Continuation pattern in uptrends, reversal at support
Bearish Marubozu:
- Opens at/near high, closes at/near low
- Shows complete selling dominance
- Continuation in downtrends, reversal at resistance
3. Two-Candle Patterns
Two-candle patterns involve the interaction between consecutive candles and often provide more reliable signals than single patterns.
🔥 Engulfing Pattern (Most Reliable!)
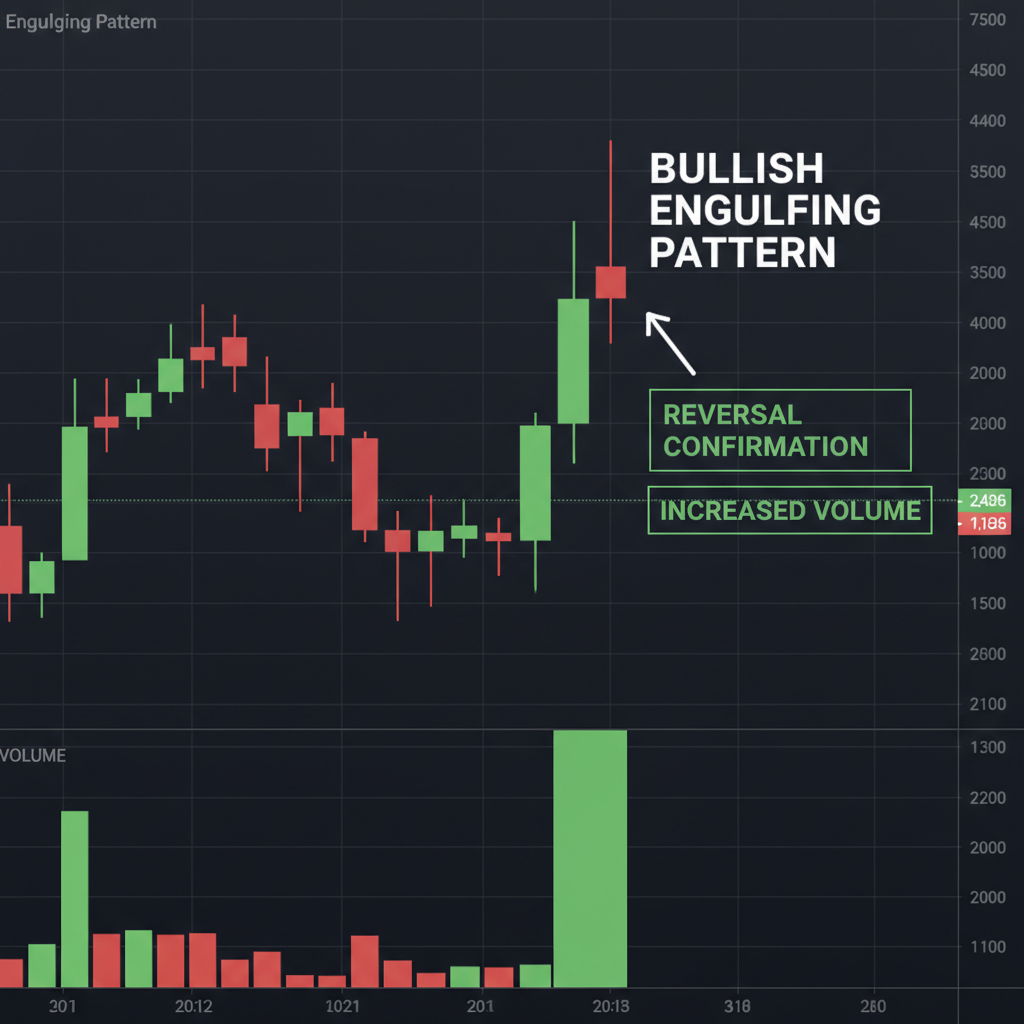
Formation: The second candle's body completely engulfs (covers) the first candle's body.
Bullish Engulfing:
- Small bearish candle followed by large bullish candle
- Second candle opens below first's close and closes above first's open
- Signals strong reversal from bearish to bullish
- Success rate: 63-70% when at support
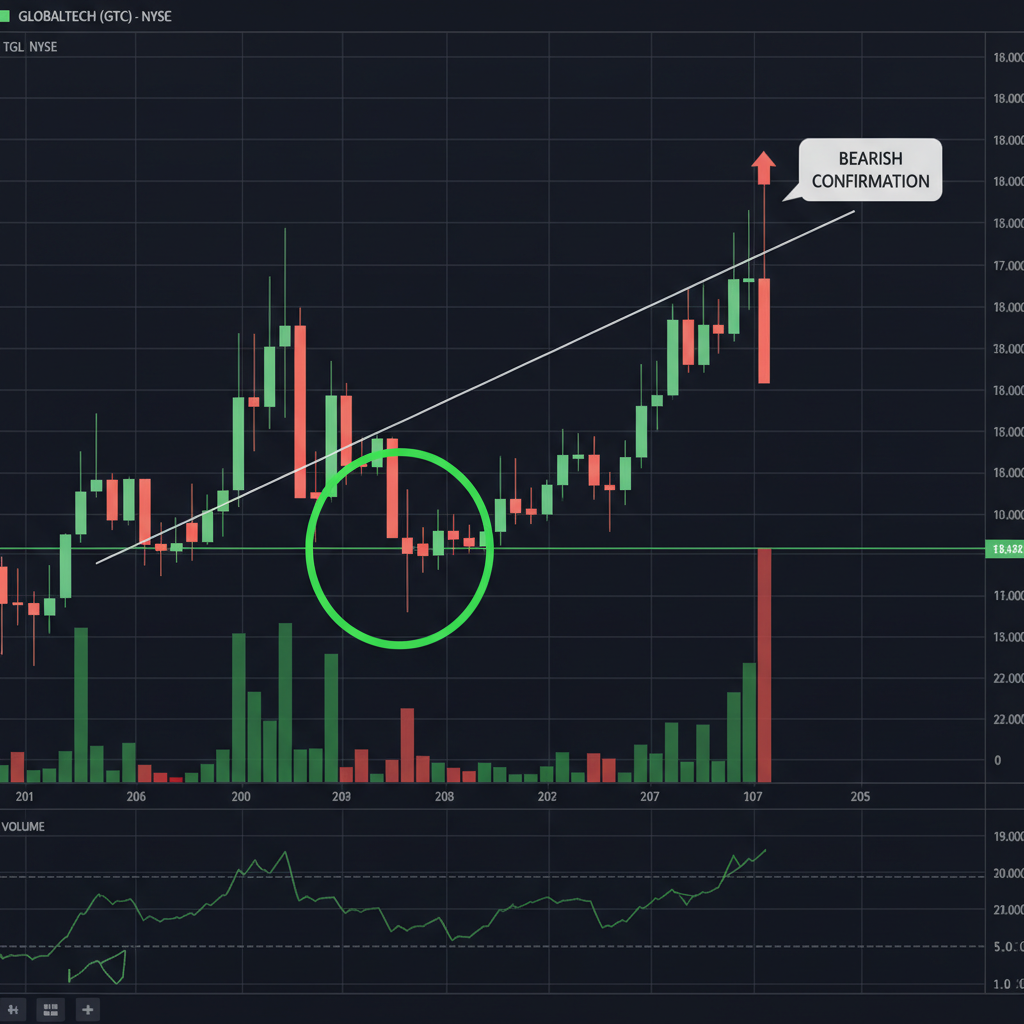
Bearish Engulfing:
- Small bullish candle followed by large bearish candle
- Second candle opens above first's close and closes below first's open
- Signals strong reversal from bullish to bearish
- Most reliable at resistance levels
Trading Rules:
- Pattern must appear at key support/resistance
- Larger the engulfing candle, stronger the signal
- Higher volume on engulfing candle increases reliability
- Enter on close of engulfing candle or next candle's open
- Stop-loss: Below engulfing low (bullish) or above engulfing high (bearish)
Real Example - GBP/USD:
Price in uptrend reaches resistance at 1.2700. First candle: small green (+15 pips). Second candle: large red, opens at 1.2705, closes at 1.2655 (-50 pips), completely engulfing first. Bearish engulfing confirmed. Enter short at 1.2655, stop at 1.2720, target 1.2550. Result: +105 pips profit, Risk-Reward: 1:1.6.
☁️ Piercing Pattern & Dark Cloud Cover
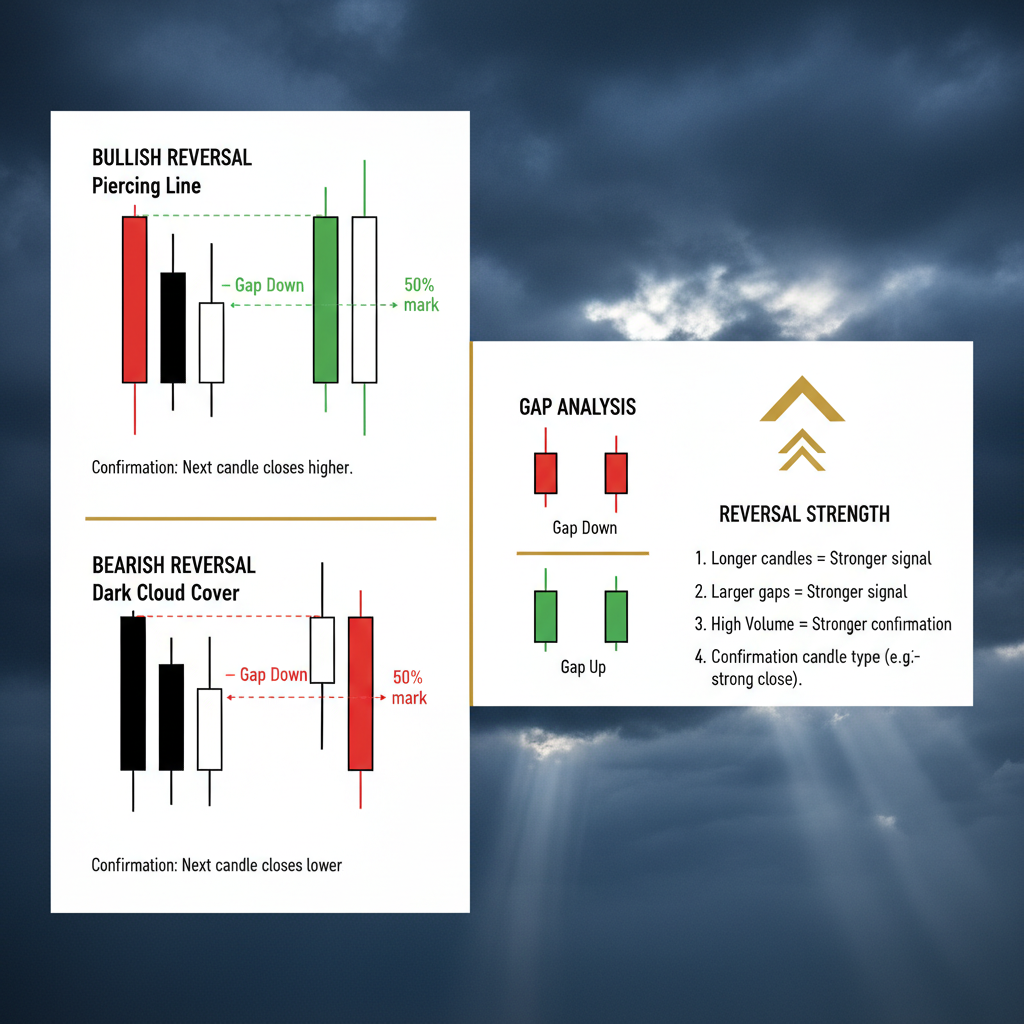
Piercing Pattern (Bullish):
- Forms at the bottom of downtrend
- First candle: large bearish candle
- Second candle: opens below first's low (gap down), closes above 50% of first candle's body
- Shows buyers stepping in aggressively
- Ideal: second candle closes above 2/3 of first candle
Dark Cloud Cover (Bearish):
- Forms at the top of uptrend
- First candle: large bullish candle
- Second candle: opens above first's high (gap up), closes below 50% of first candle's body
- Shows sellers taking control despite initial strength
- More bearish if closes below 2/3 of first candle
🔧 Tweezer Tops and Bottoms
Formation: Two consecutive candles with matching highs (tweezer top) or matching lows (tweezer bottom).
Tweezer Bottom (Bullish):
- Two candles with identical or near-identical lows
- First candle bearish, second bullish (ideal)
- Shows support level being tested and holding
- Appears at the end of downtrends
Tweezer Top (Bearish):
- Two candles with identical or near-identical highs
- First candle bullish, second bearish (ideal)
- Shows resistance being tested and holding
- Appears at the end of uptrends
🤰 Harami Pattern
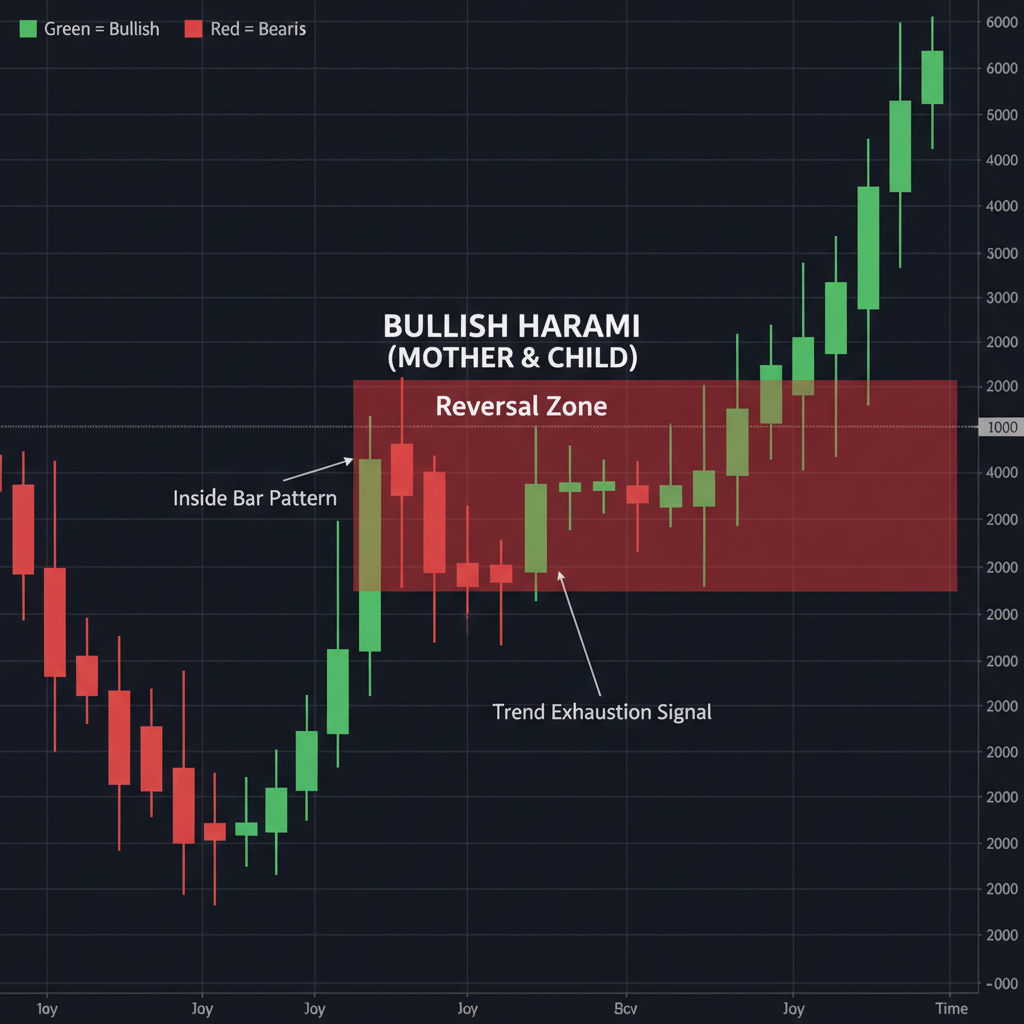
Formation: Second candle's body is completely contained within the first candle's body (opposite of engulfing).
Bullish Harami:
- Large bearish candle followed by small bullish candle inside it
- Signals potential end of downtrend
- Shows selling pressure weakening
- Needs confirmation for reliable signal
Bearish Harami:
- Large bullish candle followed by small bearish candle inside it
- Signals potential end of uptrend
- Shows buying pressure weakening
- More reliable at resistance levels
Note: Harami is less reliable than engulfing but still valuable when combined with other factors.
4. Three-Candle Patterns
Three-candle patterns are among the most powerful and reliable reversal signals in candlestick analysis.
🌅 Morning Star & Evening Star (Highly Reliable!)
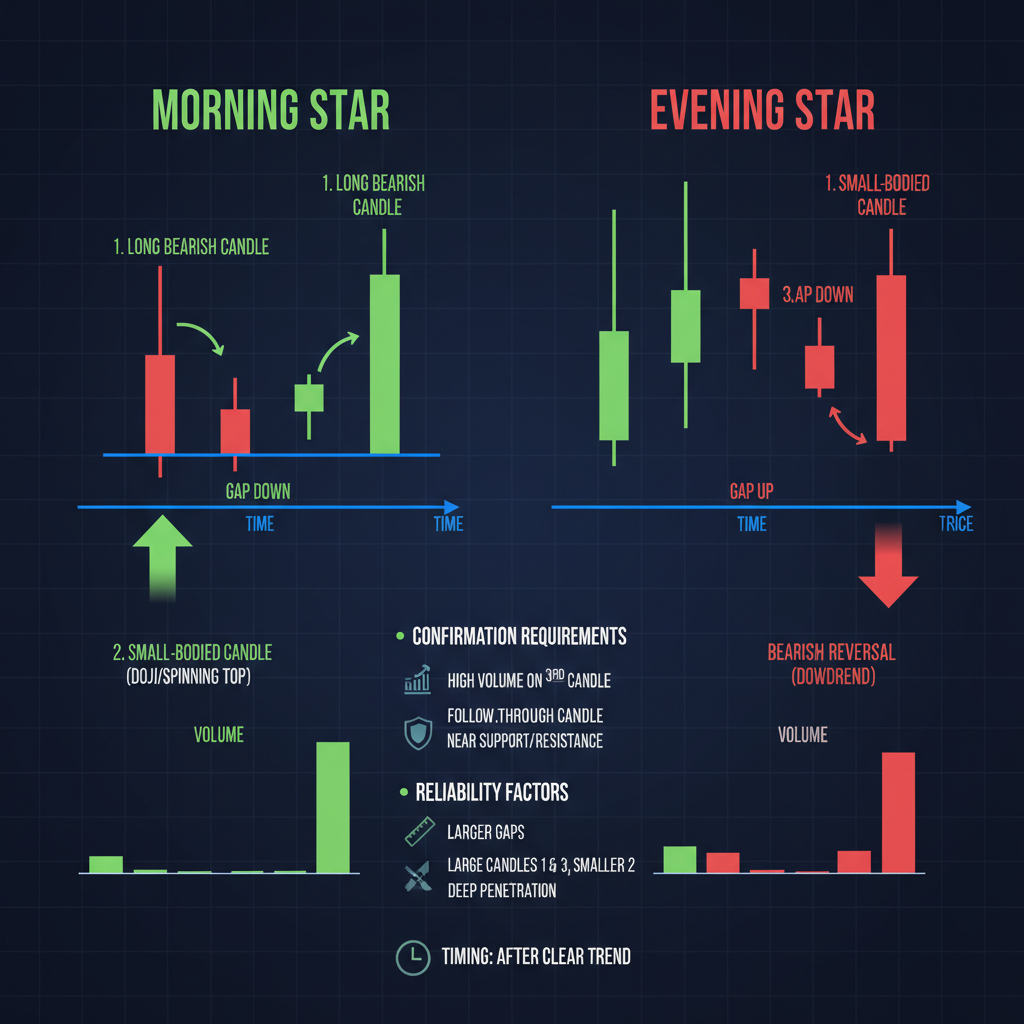
Morning Star (Bullish):
- First Candle: Large bearish candle (downtrend continuation)
- Second Candle: Small body (either color), ideally gaps down. Shows indecision.
- Third Candle: Large bullish candle that closes above midpoint of first candle
Success Rate: 65-72% when at support. Signals strong bullish reversal.
Evening Star (Bearish):
- First Candle: Large bullish candle (uptrend continuation)
- Second Candle: Small body (either color), ideally gaps up. Shows indecision.
- Third Candle: Large bearish candle that closes below midpoint of first candle
Success Rate: 65-72% when at resistance. Signals strong bearish reversal.
Why So Reliable? Three-candle sequence shows complete psychological shift: strong trend → indecision → reversal. The gap in the middle amplifies the signal.
🪖 Three White Soldiers & Three Black Crows
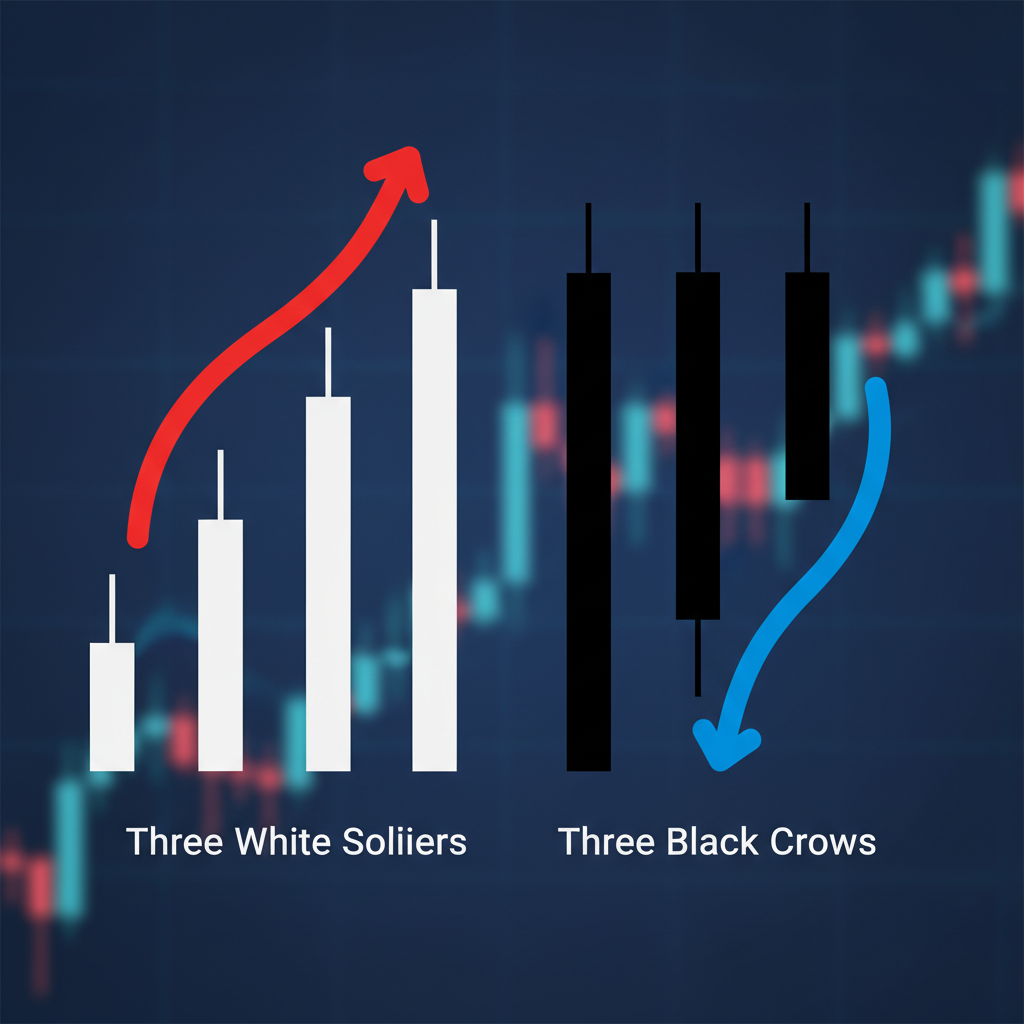
Three White Soldiers (Bullish):
- Three consecutive large bullish candles
- Each opens within previous candle's body
- Each closes progressively higher
- Little to no upper wicks (shows sustained buying)
- Signals strong bullish momentum and trend reversal
- Most powerful after downtrend at support
Three Black Crows (Bearish):
- Three consecutive large bearish candles
- Each opens within previous candle's body
- Each closes progressively lower
- Little to no lower wicks (shows sustained selling)
- Signals strong bearish momentum and trend reversal
- Most powerful after uptrend at resistance
Trading Caution: These patterns are strong but can lead to late entries since you're waiting for three candles. Consider entering on second soldier/crow with confirmation.
📊 Three Inside Up/Down
Three Inside Up (Bullish):
- Large bearish candle
- Small bullish candle inside first (harami)
- Third bullish candle closes above first candle's high
Essentially a harami with bullish confirmation. More reliable than standard harami.
Three Inside Down (Bearish):
- Large bullish candle
- Small bearish candle inside first (harami)
- Third bearish candle closes below first candle's low
Harami with bearish confirmation. Signals strong reversal potential.
5. Trading with Candlestick Patterns
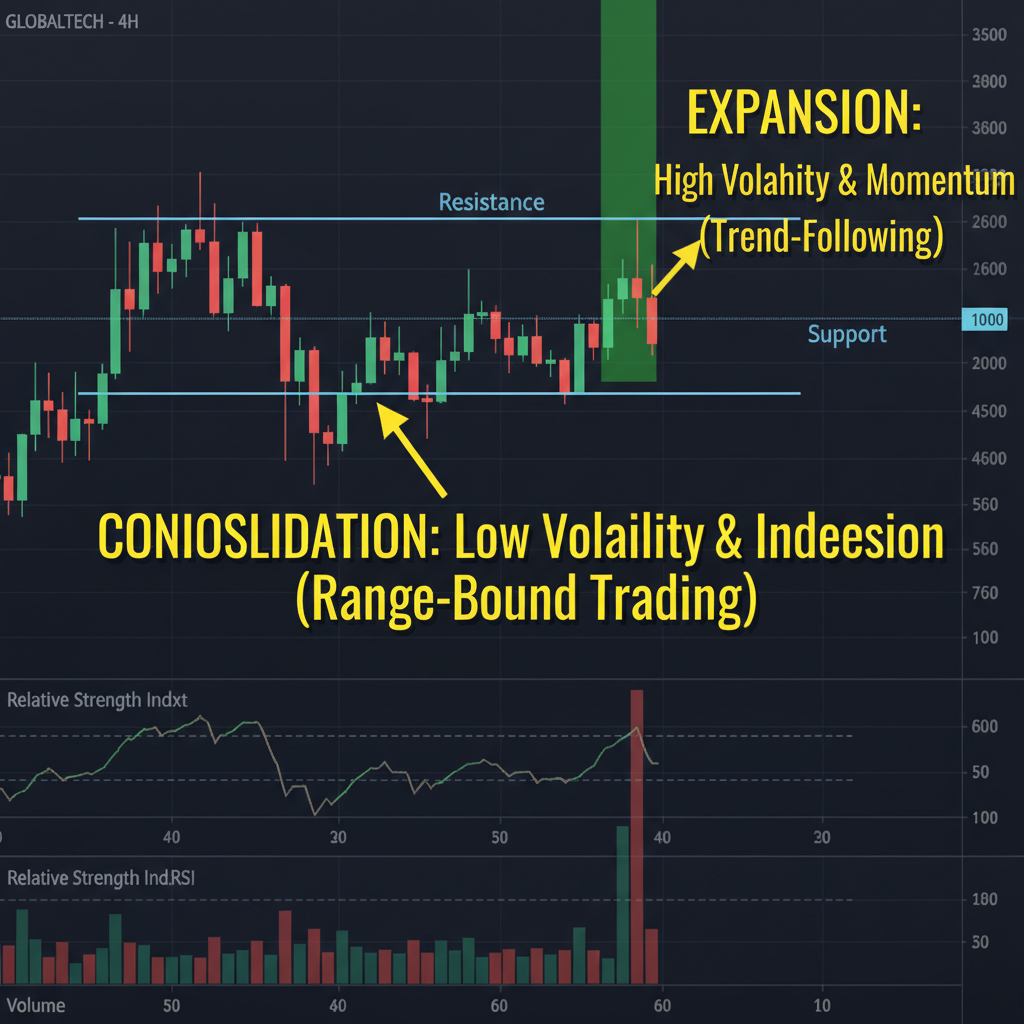
Context is Everything!
The same candlestick pattern can have completely different meanings depending on context. NEVER trade patterns in isolation. Always consider:
1. Overall Trend
- Uptrend: Focus on bullish reversal patterns at support (hammers, morning stars, bullish engulfing)
- Downtrend: Focus on bearish reversal patterns at resistance (shooting stars, evening stars, bearish engulfing)
- Sideways: Patterns are less reliable; trade range bounces instead
2. Support and Resistance
- Patterns at major S/R levels are 3-4x more reliable
- Hammer at support in uptrend: High probability bullish
- Shooting star at resistance in downtrend: High probability bearish
- Patterns in "no man's land" (away from key levels): Low reliability
3. Technical Indicators for Confirmation
- RSI: Bullish pattern + oversold RSI (<30) = strong buy signal
- MACD: Pattern + MACD bullish crossover = confirmation
- Moving Averages: Pattern at 50 or 200 EMA = high probability
- Volume: Higher volume on reversal candle = stronger signal
Entry and Exit Strategy
Entry Rules:
- Wait for pattern to complete fully
- Ideally, wait for confirmation candle (next candle moves in pattern's direction)
- Enter on close of confirmation candle or open of next
- For aggressive entries: enter on close of reversal pattern itself
Stop-Loss Placement:
- Bullish Patterns: Stop 10-20 pips below the pattern's lowest wick
- Bearish Patterns: Stop 10-20 pips above the pattern's highest wick
- Conservative: Stop below/above nearest support/resistance level
- Aggressive: Tight stop just beyond pattern's extreme
Take-Profit Targets:
- Conservative: Next support/resistance level (1:1 or 1:2 risk-reward)
- Moderate: Swing high/low or major S/R (1:2 or 1:3 risk-reward)
- Aggressive: Fibonacci extension levels or trailing stop
Pattern Failures and Exit Rules
Not all patterns work. Know when to exit losing trades quickly:
• Stop-loss is hit (never move stops against your position!)
• Opposite pattern forms before reaching target
• Strong momentum breaks pattern's extreme (hammer's low, shooting star's high)
• Major news event negates technical setup
• Next 2-3 candles show no follow-through in expected direction
Combining with Other Technical Analysis

The most successful traders combine candlestick patterns with comprehensive technical analysis:
| Combination | Description | Success Rate |
|---|---|---|
| Candlesticks + Trend Lines | Pattern at trend line creates strong confluence | 68-75% |
| Candlesticks + Fibonacci | Pattern at 61.8% retracement level | 70-78% |
| Candlesticks + Moving Averages | Pattern at 50 or 200 EMA | 65-72% |
| Candlesticks + Support/Resistance | Pattern at major S/R level | 72-80% |
| Triple Confirmation | Pattern + S/R + Indicator confluence | 78-85% |
Common Mistakes to Avoid
- Trading Every Pattern: Not all patterns are equal. Focus on high-probability setups at key levels
- Ignoring Context: Same pattern means different things in different contexts
- No Confirmation: Wait for at least one confirmation signal before entering
- Wrong Timeframe: Lower timeframes create false signals. Use H4 or Daily for reliability
- Moving Stop-Loss: Honor your stops! Moving them leads to larger losses
- Overleveraging: Even reliable patterns fail 30-40% of the time. Risk only 1-2% per trade
Frequently Asked Questions
⚠️ Risk Disclaimer
Trading foreign exchange (Forex) carries substantial risk and may not be suitable for all investors. Candlestick patterns are tools for analysis, not guarantees of future price movements. Even the most reliable patterns fail 30-40% of the time.
Before trading Forex, you should carefully consider your investment objectives, level of experience, and risk appetite. The possibility exists that you could sustain losses in excess of your initial deposit. Only trade with money you can afford to lose.
This article is for educational purposes only and does not constitute financial advice, investment advice, or trading recommendations. Past performance of patterns is not indicative of future results. Always conduct your own analysis and consult with licensed financial advisors before making trading decisions.
Risk Management is Mandatory: Never risk more than 1-2% of your trading capital on a single trade, always use stop-loss orders, and never trade based solely on candlestick patterns without confirmation from other technical analysis tools. Trading without proper risk management can lead to substantial financial losses.
Comments
Post a Comment