
Technical Analysis for Beginners: Reading Forex Charts
🎯 Master the Art of Chart Reading
Welcome to the world of forex technical analysis! Whether you're taking your first steps into currency trading or looking to strengthen your chart reading skills, this comprehensive guide will teach you everything you need to know about analyzing forex charts like a professional trader.
1. Introduction to Technical Analysis
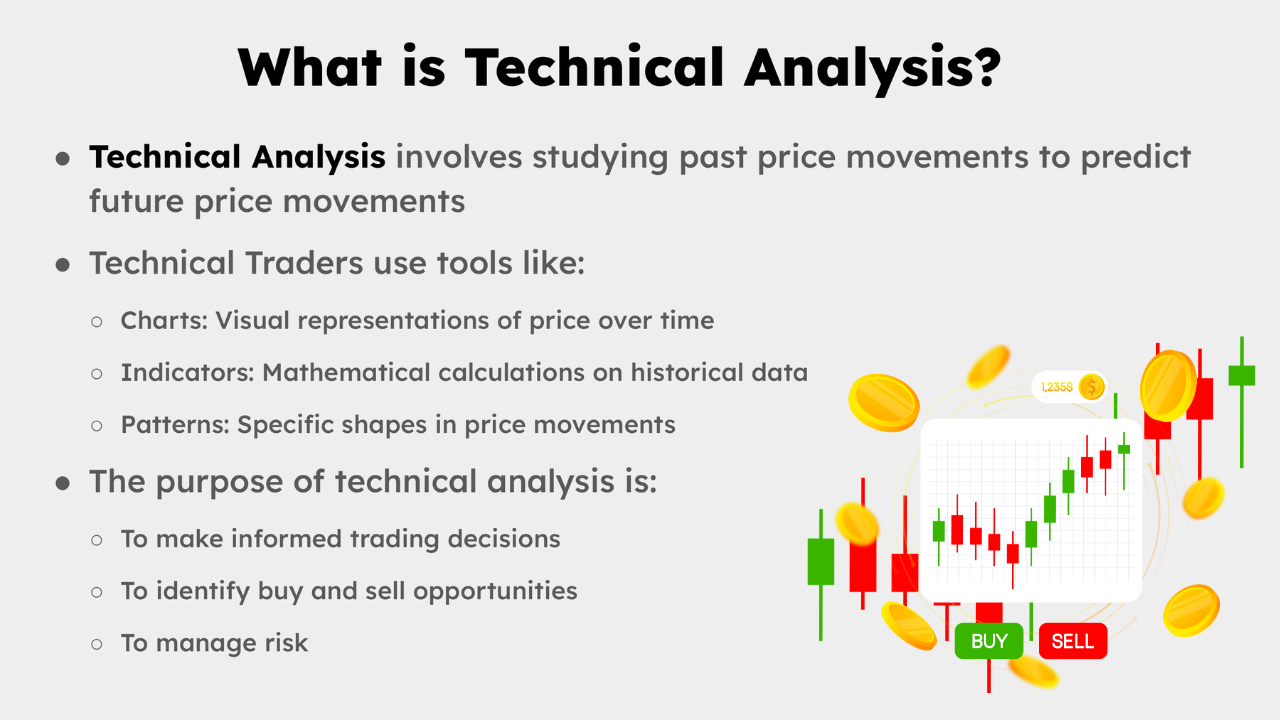
Technical analysis is the study of historical price movements to predict future price direction in financial markets. Unlike fundamental analysis, which focuses on economic factors and news events, technical analysis relies purely on price action and chart patterns.
What is Technical Analysis?
Technical analysis involves examining price charts, volume data, and various indicators to identify trading opportunities. The core principle is that all market information is already reflected in the price, making it possible to predict future movements by studying past behavior.
💡 Core Principles of Technical Analysis:
- Price discounts everything - All fundamental factors are already reflected in the current price
- History repeats itself - Market patterns tend to repeat due to human psychology
- Trend is your friend - Prices move in identifiable trends that persist over time
Technical vs. Fundamental Analysis
While fundamental analysis examines economic indicators, interest rates, and political events, technical analysis focuses exclusively on price movements and chart patterns. Many successful forex traders combine both approaches, but technical analysis provides more precise entry and exit timing.
| Technical Analysis | Fundamental Analysis |
|---|---|
| Studies price charts and patterns | Analyzes economic data and news |
| Short to medium-term trading | Long-term market trends |
| Precise entry/exit timing | Market direction prediction |
| Chart patterns, indicators | GDP, inflation, employment data |
Why Technical Analysis Works in Forex
The forex market is particularly well-suited for technical analysis because:
- High liquidity ensures price movements reflect true market sentiment
- 24/5 market provides continuous price data
- Large participant base creates reliable patterns
- Standardized currency pairs allow for consistent analysis approaches
2. Chart Types Explained
Understanding different chart types is fundamental to technical analysis. Each chart type displays the same price information but emphasizes different aspects of market behavior.
Line Charts: The Simplest View
Line charts connect closing prices over time, creating a smooth line that shows the overall price trend. While simple, line charts can sometimes hide important intraday price movements.
📊 When to Use Line Charts:
Line charts are perfect for beginners to identify overall trends and support/resistance levels without getting distracted by short-term price fluctuations.
Bar Charts: OHLC Data
Bar charts display four crucial price points for each time period:
- Open - The opening price
- High - The highest price reached
- Low - The lowest price reached
- Close - The closing price
Candlestick Charts: Most Popular Choice
Candlestick charts originated in Japan and have become the preferred choice for most forex traders. They display the same OHLC information as bar charts but in a more visually appealing format.

🕯️ Understanding Candlestick Components:
- Body - The thick part showing open to close range
- Wicks/Shadows - Thin lines showing high and low points
- Color - Green/white for bullish, red/black for bearish
Choosing the Right Chart Type
For beginners, we recommend starting with candlestick charts because they:
- Provide comprehensive price information
- Make pattern recognition easier
- Show market sentiment clearly
- Are used by most professional traders
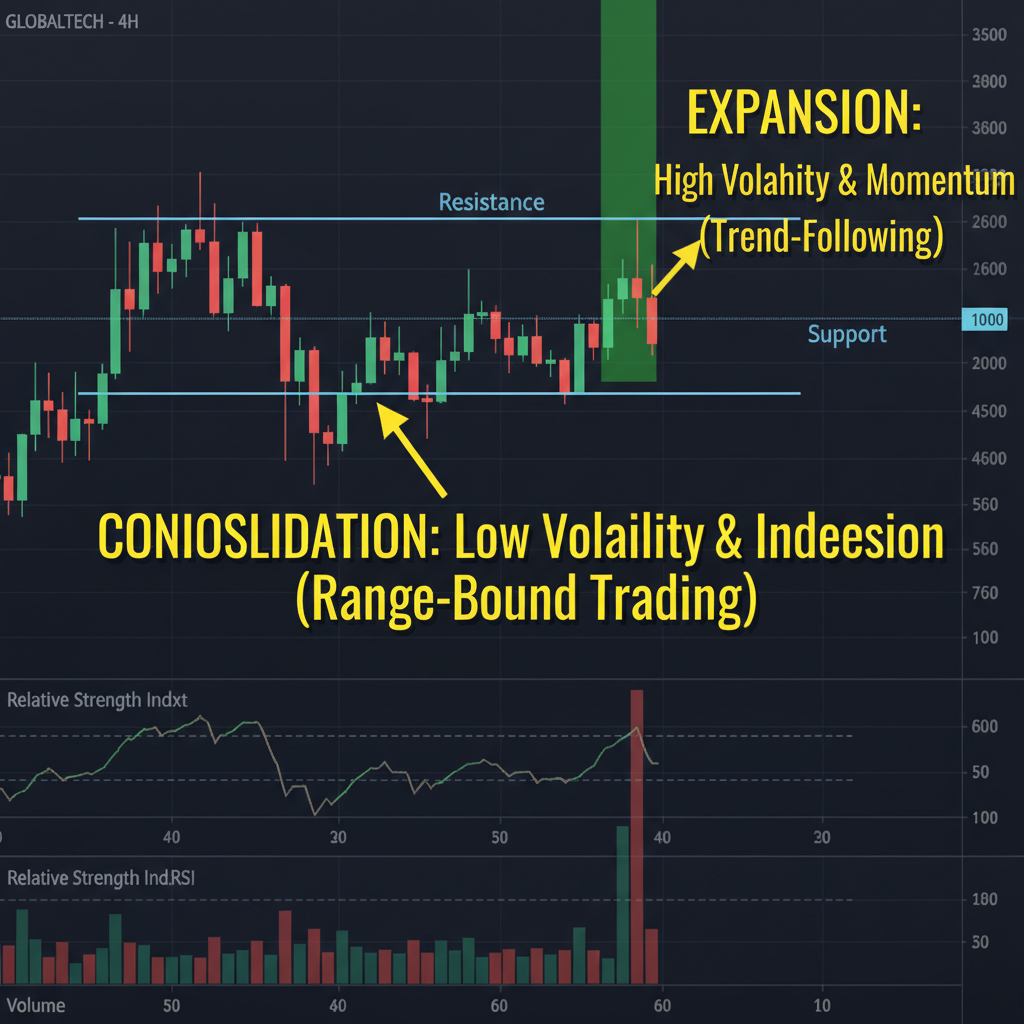
3. Understanding Support and Resistance
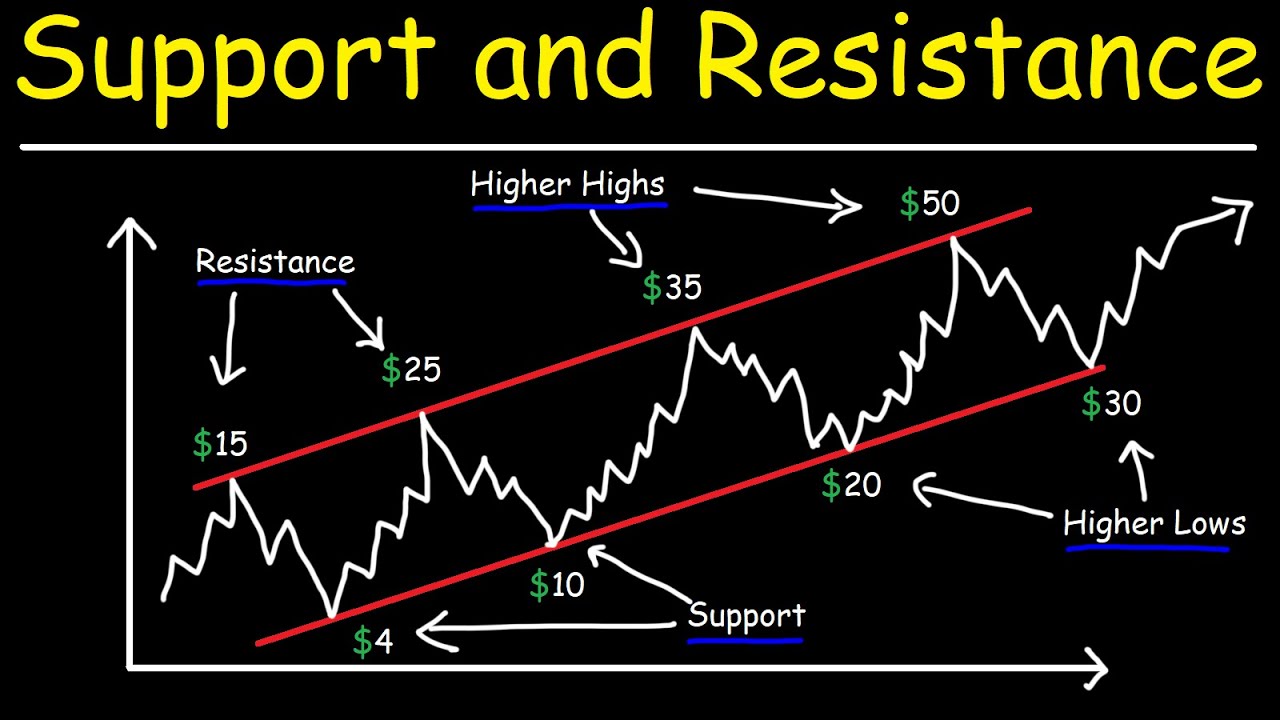
Support and resistance levels are among the most important concepts in technical analysis. These levels represent psychological price points where buying or selling pressure tends to emerge.
What are Support and Resistance?
- Support - A price level where demand (buying pressure) is strong enough to prevent further decline
- Resistance - A price level where supply (selling pressure) is strong enough to prevent further advance
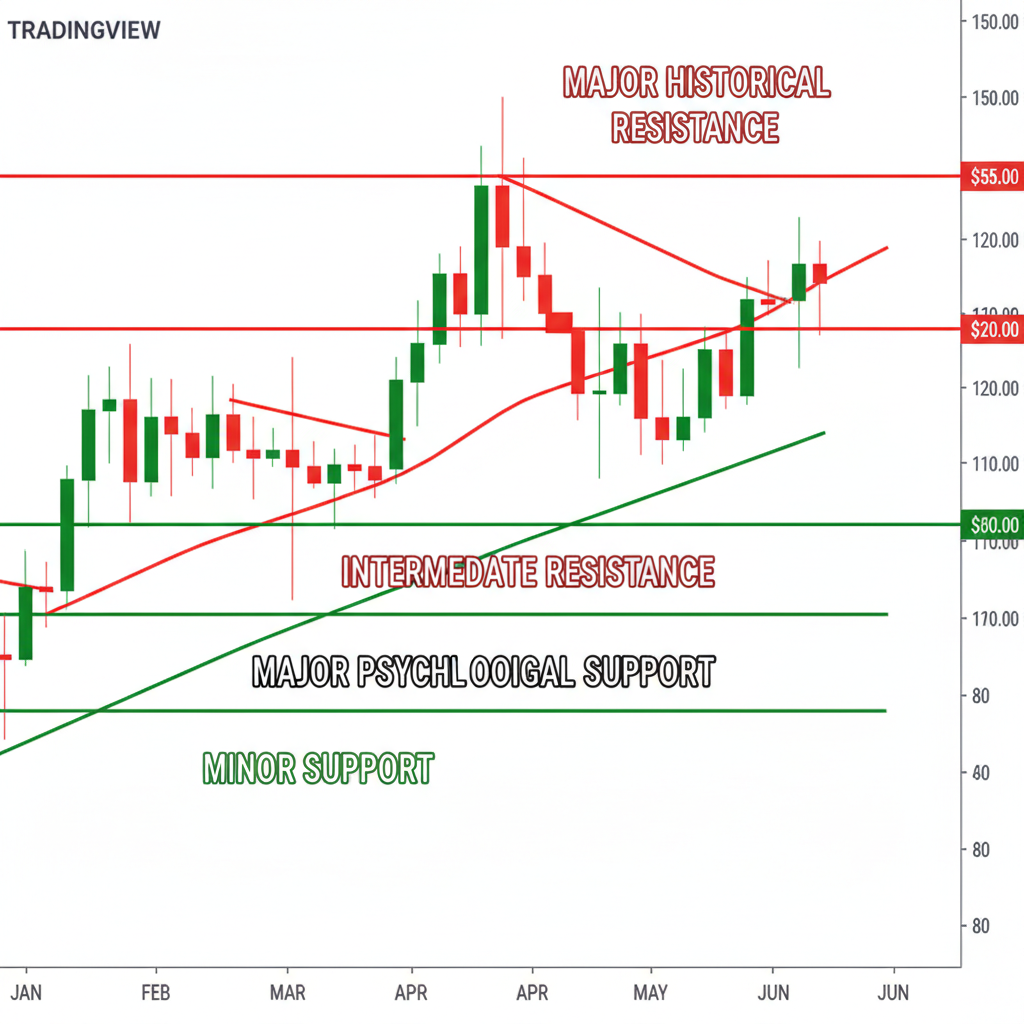
How to Identify Support and Resistance Levels
Look for areas where price has:
- Bounced multiple times - The more times price respects a level, the stronger it becomes
- Struggled to break through - Failed breakout attempts strengthen levels
- Round numbers - Psychological levels like 1.2000, 1.2500 often act as support/resistance
- Previous swing highs/lows - Historical turning points often repeat
⚠️ Important Note: Role Reversal
When a support level is broken, it often becomes a resistance level, and vice versa. This concept is crucial for understanding market dynamics and setting proper entry/exit points.
Trading Strategies Using Support and Resistance
Common strategies include:
- Bounce Trading - Buy at support, sell at resistance
- Breakout Trading - Trade when price breaks through key levels
- Pullback Trading - Enter after a breakout and retest of the broken level
4. Basic Chart Patterns
Chart patterns are formations created by price movements that tend to repeat over time. Recognizing these patterns can help predict future price direction and provide valuable trading opportunities.
Reversal Patterns
Reversal patterns signal potential trend changes:
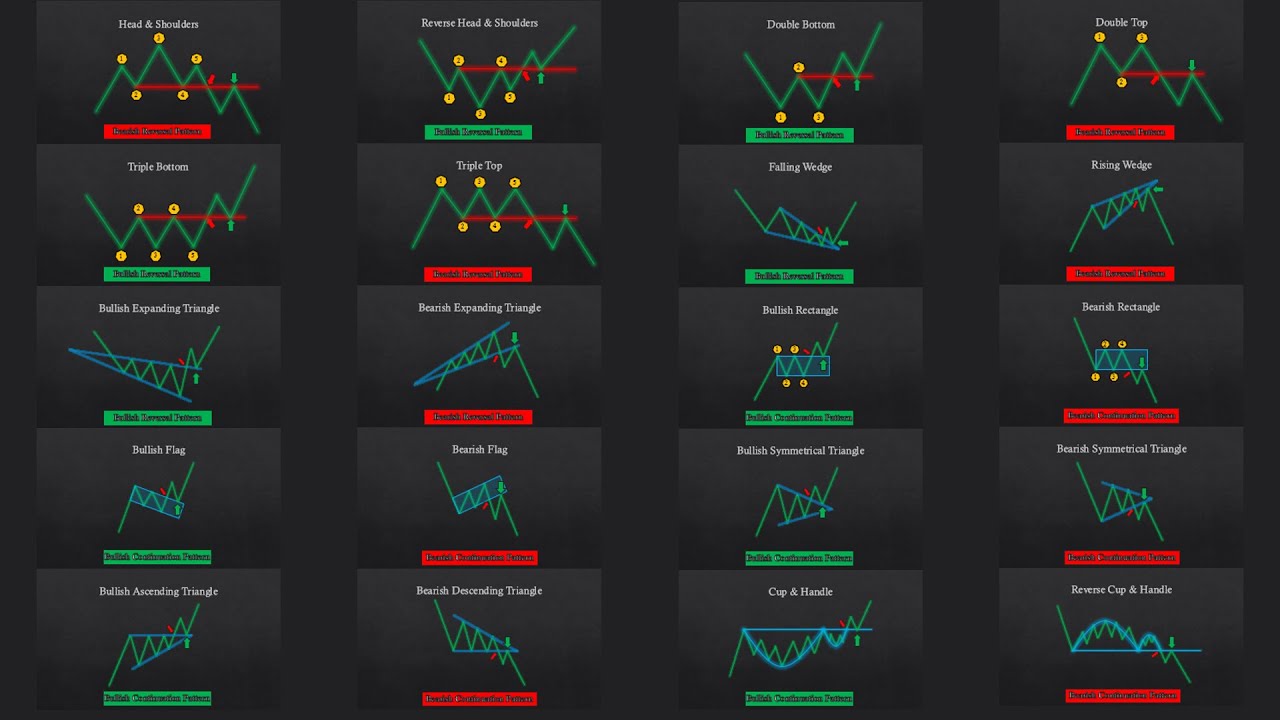
Head and Shoulders
The head and shoulders pattern is one of the most reliable reversal patterns, consisting of three peaks with the middle peak (head) being higher than the other two (shoulders).
📈 Head and Shoulders Components:
- Left Shoulder - First peak with pullback
- Head - Higher peak in the middle
- Right Shoulder - Third peak, similar height to left shoulder
- Neckline - Support line connecting the lows
Double Top and Double Bottom
These patterns occur when price tests the same level twice and fails to break through, indicating potential reversal.
Continuation Patterns
Continuation patterns suggest the current trend will continue:
- Flags - Brief consolidation periods that slope against the trend
- Pennants - Small triangular consolidations
- Triangles - Converging trendlines showing indecision
Pattern Recognition Tips
🎯 Pro Tips for Pattern Recognition:
- Practice identifying patterns on historical charts
- Don't force patterns - only trade clear, well-formed setups
- Consider volume confirmation when available
- Always wait for pattern completion before entering trades
- Use multiple timeframes to confirm pattern validity
5. Your First Technical Analysis Workflow
Developing a systematic approach to technical analysis is crucial for consistent results. This workflow will guide you through analyzing any forex pair systematically.
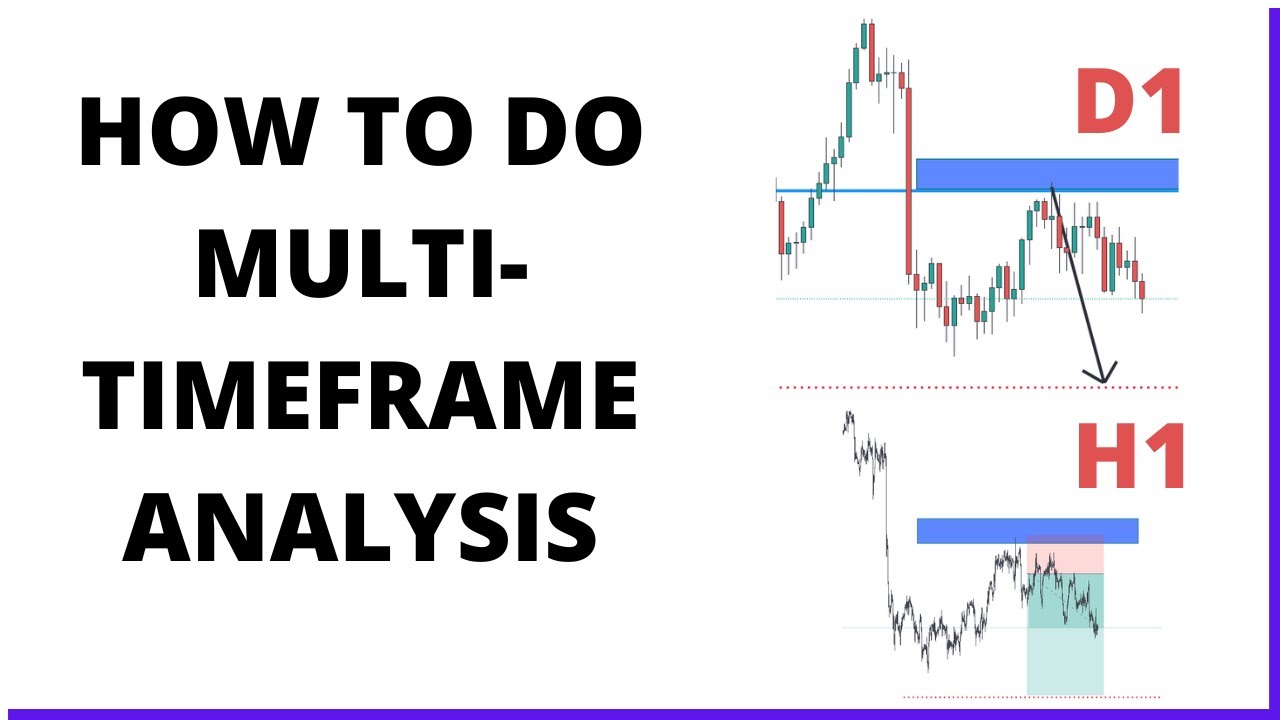
Step 1: Top-Down Analysis Approach
Start your analysis from higher timeframes and work your way down:
- Monthly Chart - Identify long-term trend and major levels
- Weekly Chart - Confirm trend and find key support/resistance
- Daily Chart - Look for trade setups and patterns
- 4-Hour Chart - Refine entry timing
- 1-Hour Chart - Final entry and exit decisions
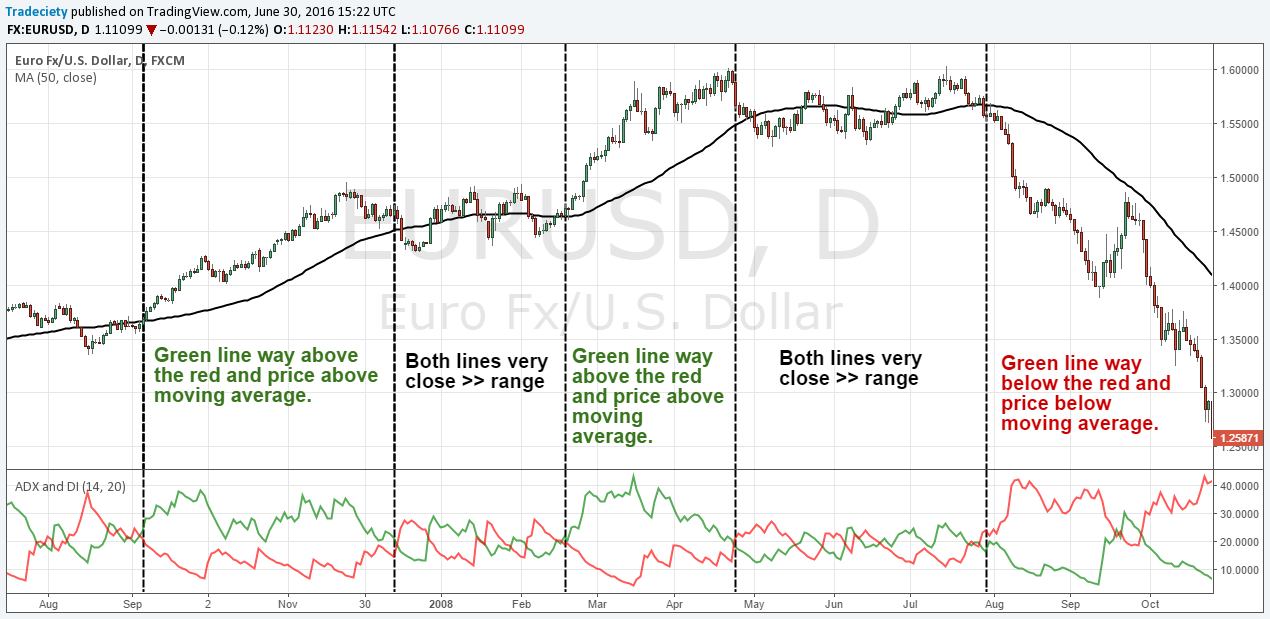
Step 2: Identify the Primary Trend
On your higher timeframe charts, determine the overall market direction:
- Uptrend - Series of higher highs and higher lows
- Downtrend - Series of lower highs and lower lows
- Sideways - Price moving within a range
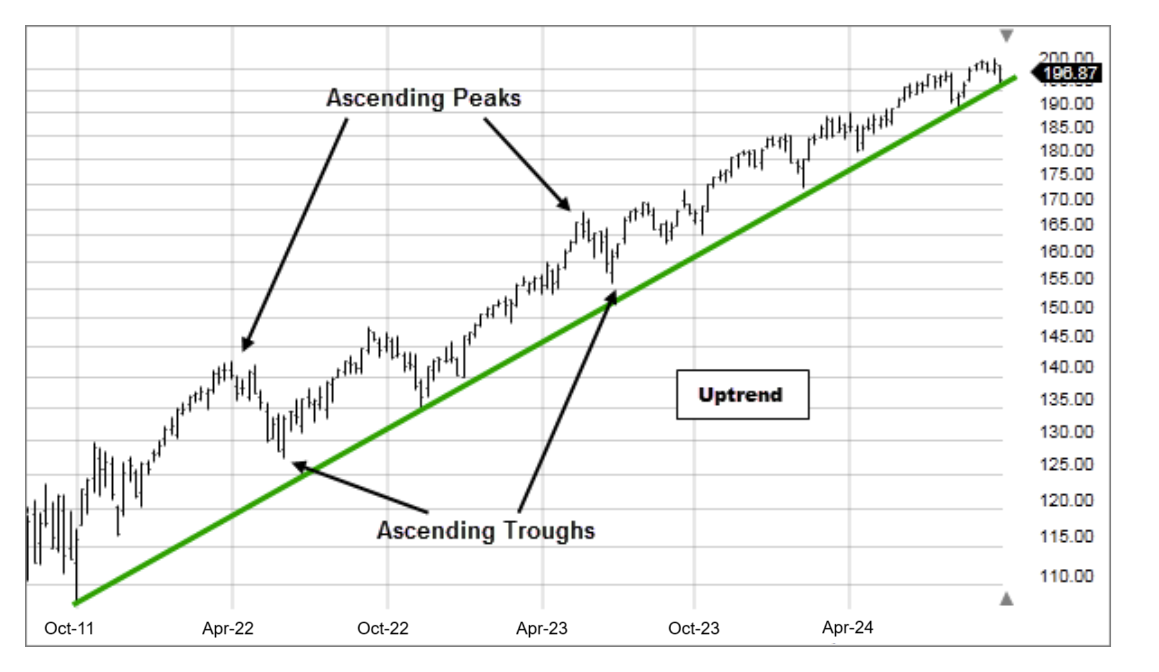
⚠️ Golden Rule: Trade with the Trend
As a beginner, always trade in the direction of the primary trend. Fighting the trend is one of the fastest ways to lose money in forex trading.
Step 3: Find High-Probability Entry Points
Once you've identified the trend, look for entry opportunities on lower timeframes:
- Pullbacks to support in uptrends
- Bounces from resistance in downtrends
- Breakouts from consolidation patterns
- Candlestick reversal patterns at key levels
Step 4: Combine Multiple Techniques
The most reliable setups combine several technical elements:
- Trend + Support/Resistance + Pattern = High probability trade
- Multiple timeframe confirmation
- Volume confirmation (when available)
- Risk-reward ratio of at least 1:2
Practice Exercises
📚 Homework for New Technical Analysts:
- Chart Time - Spend 30 minutes daily studying charts
- Pattern Journal - Screenshot and annotate patterns you find
- Demo Trading - Practice your setups without risking real money
- Historical Analysis - Study how patterns played out in the past
- Multiple Pairs - Analyze different currency pairs to find the best opportunities
Common Beginner Mistakes to Avoid
- Over-analyzing - Don't let perfect be the enemy of good
- Ignoring higher timeframes - Always check the bigger picture
- Trading against the trend - Stick with the primary direction
- No risk management - Always use stop losses
- Emotional trading - Stick to your analysis plan
🎯 Your Technical Analysis Journey Begins Now
Congratulations! You now have a solid foundation in forex technical analysis. Remember, becoming proficient at reading charts takes time and practice. Start with the basics, develop a consistent approach, and gradually build your skills through experience.
Key Takeaways: Master chart types, understand support and resistance, recognize basic patterns, and always use a systematic workflow. With dedication and practice, you'll soon be reading forex charts like a professional trader!
Frequently Asked Questions
⚠️ Risk Disclaimer
Forex trading involves substantial risk of loss and is not suitable for all investors. The valuation of currencies may fluctuate, and you may lose more than your original investment. Before deciding to trade foreign exchange you should carefully consider your investment objectives, level of experience, and risk appetite. Technical analysis does not guarantee profitable outcomes and past performance is not indicative of future results. Always seek advice from an independent financial advisor if you have any doubts.
Comments
Post a Comment