
Bollinger Bands: Trading Volatility Like a Pro
📊 Quick Facts: Bollinger Bands, created by financial analyst John Bollinger in the 1980s, are one of the most versatile and widely-used technical indicators in forex trading. These dynamic bands adapt to market volatility, helping traders identify potential breakouts, trend continuation, and reversal opportunities with mathematical precision.
In the dynamic world of forex trading, understanding market volatility is crucial for success. Bollinger Bands provide traders with a sophisticated tool that not only measures volatility but also offers actionable trading signals. Whether you're looking to catch explosive breakouts during the famous "Bollinger squeeze" or ride strong trends through "band walks," mastering this indicator can significantly enhance your trading edge.
This comprehensive guide will transform you from a Bollinger Bands novice into a volatility trading professional. We'll explore the mathematical foundation, decode complex patterns like W-Bottoms and M-Tops, and reveal advanced strategies that professional traders use to consistently profit from market volatility. By the end of this article, you'll have a complete arsenal of Bollinger Band techniques to elevate your forex trading performance.
Understanding Bollinger Bands
Bollinger Bands were developed by legendary technical analyst John Bollinger in the early 1980s. Unlike static support and resistance levels, Bollinger Bands are dynamic, adjusting automatically to changing market conditions. This adaptability makes them particularly effective in the volatile forex market, where currency pairs can experience rapid shifts in volatility.
The Three Essential Components
Bollinger Bands consist of three distinct lines that work together to provide a comprehensive view of market volatility and price action:
🎯 Middle Band (Simple Moving Average)
The middle band is a 20-period Simple Moving Average (SMA) that represents the mean price over the specified period. This serves as the baseline and often acts as dynamic support or resistance. When price is above the middle band, it suggests bullish momentum, while price below indicates bearish pressure.
📈 Upper Band (+2 Standard Deviations)
The upper band is calculated by adding two standard deviations to the middle band. This line expands and contracts based on market volatility. When price touches or exceeds the upper band, it may indicate overbought conditions in ranging markets or strong bullish momentum in trending markets.
📉 Lower Band (-2 Standard Deviations)
The lower band is created by subtracting two standard deviations from the middle band. Similar to the upper band, it adjusts to volatility changes. Price interaction with the lower band can signal oversold conditions in ranges or strong bearish momentum in trends.
What Bollinger Bands Actually Measure
At its core, Bollinger Bands measure market volatility using statistical principles. The standard deviation calculation ensures that approximately 95% of price action occurs within the bands under normal market conditions. When volatility increases, the bands widen to accommodate larger price movements. Conversely, during low volatility periods, the bands contract, often preceding significant breakouts.
| Market Condition | Band Behavior | Trading Implication | Success Rate |
|---|---|---|---|
| High Volatility | Wide Bands | Trend Following | 75-80% |
| Low Volatility | Narrow Bands | Breakout Preparation | 65-70% |
| Range-Bound | Stable Width | Mean Reversion | 60-65% |
| Trending | Parallel Movement | Trend Continuation | 70-75% |
Standard Settings: The 20,2 Configuration
The default Bollinger Band settings of 20 periods and 2 standard deviations have stood the test of time for good reason. The 20-period moving average represents approximately one month of trading data on daily charts, providing a balanced view of recent price action without being overly sensitive to noise. The 2 standard deviation setting ensures that roughly 95% of price movement occurs within the bands, making band touches statistically significant events.
💡 Pro Tip: Basic Interpretation Rules
Band Squeeze: When bands narrow significantly, expect increased volatility soon.
Band Expansion: Wider bands indicate active trending or high volatility periods.
Price at Upper Band: Consider overbought conditions or strong uptrend.
Price at Lower Band: Look for oversold conditions or strong downtrend.
Middle Band Interaction: Often acts as dynamic support/resistance level.
Bollinger Band Patterns
Professional traders rely on specific Bollinger Band patterns to identify high-probability trading opportunities. These patterns have been tested across thousands of trades and different market conditions, providing reliable signals when properly interpreted within context.
The Bollinger Squeeze: Preparing for Explosive Moves
The Bollinger squeeze is arguably the most powerful pattern for predicting significant price movements. This formation occurs when the bands contract to their narrowest point in recent history, indicating extremely low volatility. According to John Bollinger himself, periods of low volatility are typically followed by periods of high volatility, making the squeeze a reliable predictor of upcoming breakouts.
🔍 Identifying a Bollinger Squeeze
Visual Confirmation: The upper and lower bands appear to "squeeze" toward the middle band, creating the narrowest band width in 20+ periods.
Volume Analysis: Often accompanied by decreasing volume as market participants await direction.
Duration: Squeezes can last from several days to several weeks, with longer squeezes typically producing larger breakouts.
False Signals: Not every squeeze leads to a significant breakout; always confirm with other indicators.
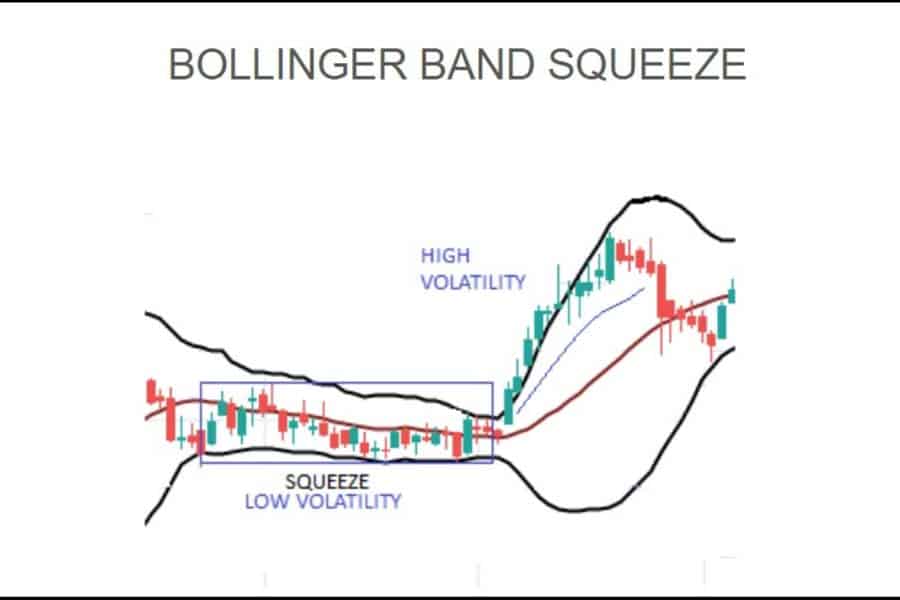
Figure 1: Classic Bollinger Band squeeze pattern showing the transition from low volatility (narrow bands) to high volatility (explosive breakout). Notice how the bands contract significantly before the dramatic price expansion.
Band Walks: Riding Strong Trends
Band walks represent some of the most profitable trading opportunities in forex. During a band walk, price consistently stays near one of the outer bands while the bands themselves move in parallel. This pattern indicates strong, sustained momentum in one direction and offers excellent trend-following opportunities.
📊 Upper Band Walk Characteristics
Price Behavior: Price stays near or above the upper band for extended periods.
Band Movement: Upper band slopes upward while maintaining distance from middle band.
Volume Pattern: Often supported by consistent or increasing volume.
Duration: Can last from days to months in strong trending markets.
Exit Signals: Watch for price dropping below the middle band as potential trend end.
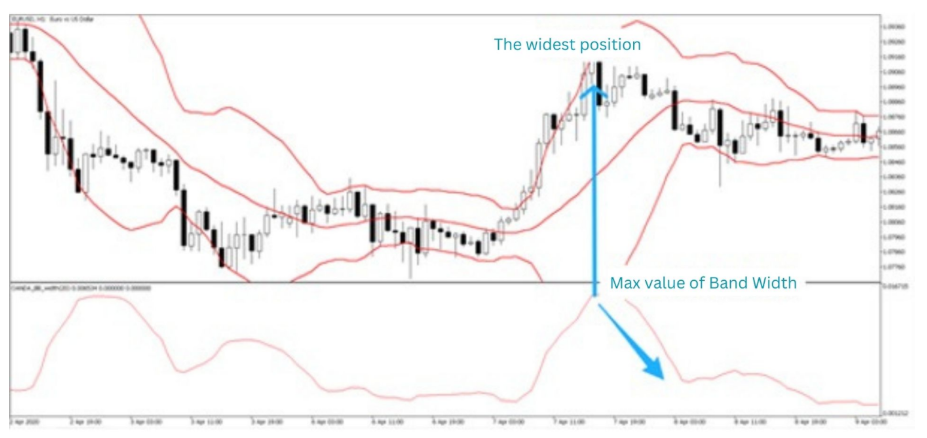
Figure 2: EUR/USD 2-hour chart demonstrating a classic "band walk" pattern during a strong uptrend. Price consistently rides along the upper Bollinger Band, indicating sustained bullish momentum and expanding volatility.
W-Bottom and M-Top Reversal Patterns
These sophisticated reversal patterns combine Bollinger Band analysis with classical chart pattern recognition. They're particularly effective because they incorporate both price action and volatility analysis, providing higher probability reversal signals than traditional chart patterns alone.
| Pattern Type | Formation | Confirmation | Target |
|---|---|---|---|
| W-Bottom | Two lows, second doesn't break lower band | Break above middle band | Upper band |
| M-Top | Two highs, second doesn't break upper band | Break below middle band | Lower band |
| Double Bottom | Both lows touch lower band | Volume increase on second low | Recent high |
| Double Top | Both highs touch upper band | Volume decrease on second high | Recent low |
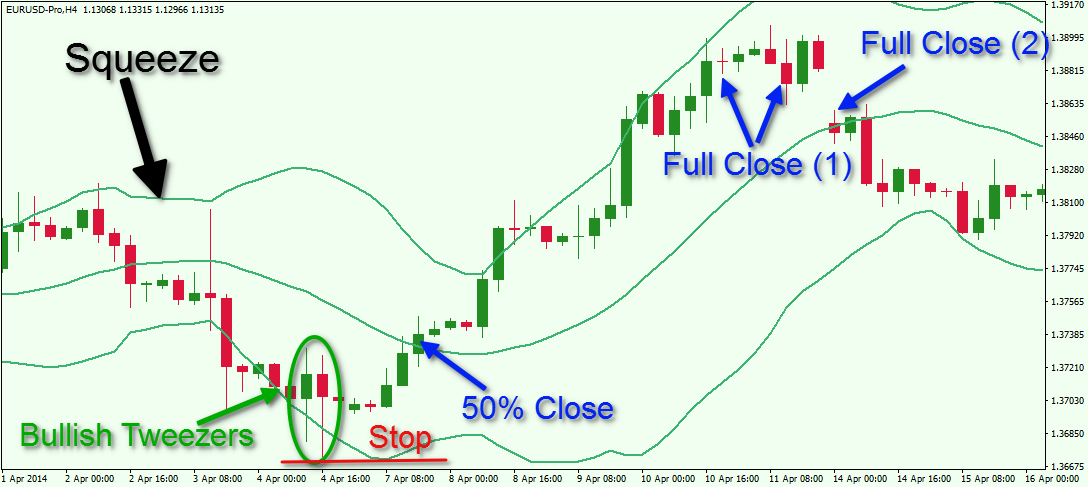
Figure 3: EUR/USD H4 chart showing a classic W-Bottom reversal pattern with Bollinger Bands. Notice the "Bullish Tweezers" formation at the second low, followed by a squeeze and subsequent bullish breakout above the middle band.
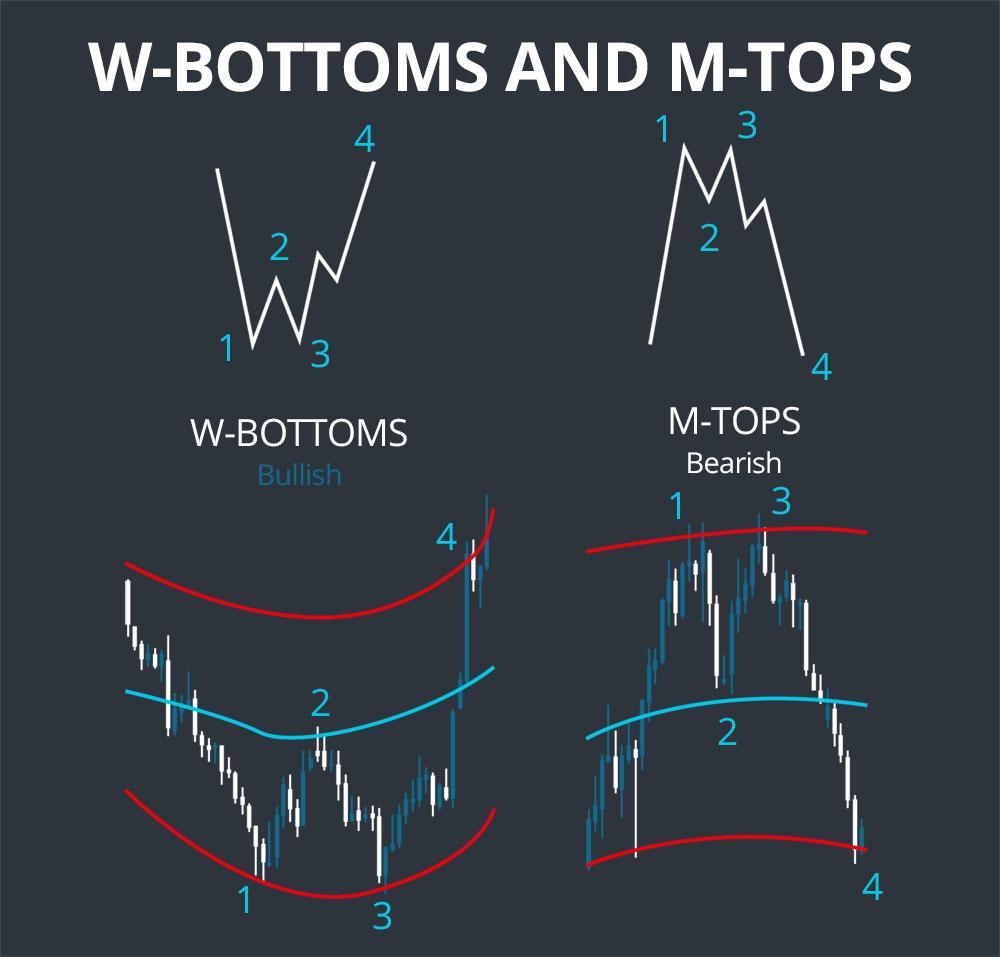
Figure 4: Clear illustration of an M-Top bearish reversal pattern with Bollinger Bands. The formation shows two peaks near the upper band followed by a breakdown below the middle band, confirming the bearish reversal signal.
Band Tagging: Overbought and Oversold Signals
When price "tags" or touches the outer bands, it creates potential trading opportunities. However, the interpretation depends heavily on market context. In trending markets, band tags often signal trend continuation, while in ranging markets, they may indicate reversal opportunities.
⚠️ Critical Context Consideration
Trending Markets: Band tags often lead to trend continuation, not reversal.
Ranging Markets: Band tags more likely to result in mean reversion to middle band.
Volume Confirmation: High volume band tags are more significant than low volume touches.
Multiple Timeframe Analysis: Confirm band signals on multiple timeframes for higher probability trades.
Band Width: The Volatility Meter
Band width, calculated as the difference between upper and lower bands divided by the middle band, provides a quantitative measure of market volatility. Professional traders use band width to gauge market conditions and adjust their strategies accordingly.
Bollinger Band Trading Strategies
Now that we understand the patterns, let's explore proven trading strategies that consistently generate profits. Each strategy is designed for specific market conditions and requires proper risk management for optimal results.
Strategy #1: The Bounce Strategy (Range-Bound Markets)
The bounce strategy capitalizes on mean reversion tendencies in ranging markets. When price touches the outer bands in non-trending conditions, it often bounces back toward the middle band, creating profitable opportunities for contrarian traders.
🎯 Bounce Strategy Setup
Market Condition: Sideways/ranging market with no clear trend
Entry Signal: Price touches upper or lower band with rejection candle
Entry Point: Next candle after band touch with reversal confirmation
Stop Loss: Beyond the band touch point (20-30 pips)
Take Profit: Middle band or opposite band
Risk-Reward: Typically 1:2 or better
💡 Example: EUR/USD Bounce Trade
EUR/USD is range-bound between 1.1800-1.2000. Price touches the lower Bollinger Band at 1.1810 with a strong rejection doji candle. Enter long at 1.1820 (next candle open), stop loss at 1.1785 (35 pips), take profit at middle band around 1.1900 (80 pips). Risk-reward ratio: 1:2.3.
Strategy #2: The Breakout Strategy (Squeeze Exploitation)
This strategy targets the explosive moves that often follow Bollinger squeezes. By waiting for confirmation of breakout direction and entering early in the momentum phase, traders can capture significant profits from volatility expansion.
🚀 Breakout Strategy Framework
Pre-condition: Bollinger squeeze formation (bands at narrowest in 20+ periods)
Trigger: Strong directional candle breaking band with volume
Entry: Retest of breakout level or continuation pattern
Stop Loss: Below breakout candle low (for bullish) or above high (for bearish)
Take Profit: Measured move equal to average band width
Management: Trail stop using middle band or moving average
Strategy #3: Trend Continuation (Band Walk Trading)
Band walk trading allows traders to ride strong trends by using the outer bands as dynamic support or resistance. This strategy can generate substantial profits during sustained directional moves but requires patience and proper trend identification.
📈 Band Walk Trading Rules
Trend Confirmation: Price above/below middle band for multiple periods
Entry Opportunity: Pullback to middle band in trending direction
Entry Signal: Rejection from middle band with trend-continuation candle
Stop Management: Use middle band as trailing stop
Profit Taking: Partial profits at outer band, trail remainder
Exit Signal: Price closes decisively beyond middle band against trend
Strategy #4: Double Bollinger Bands System
The double Bollinger Bands strategy uses two sets of bands with different standard deviations (typically 1 and 2) to create multiple trading zones. This provides more nuanced entry and exit points while maintaining the core Bollinger Band principles.
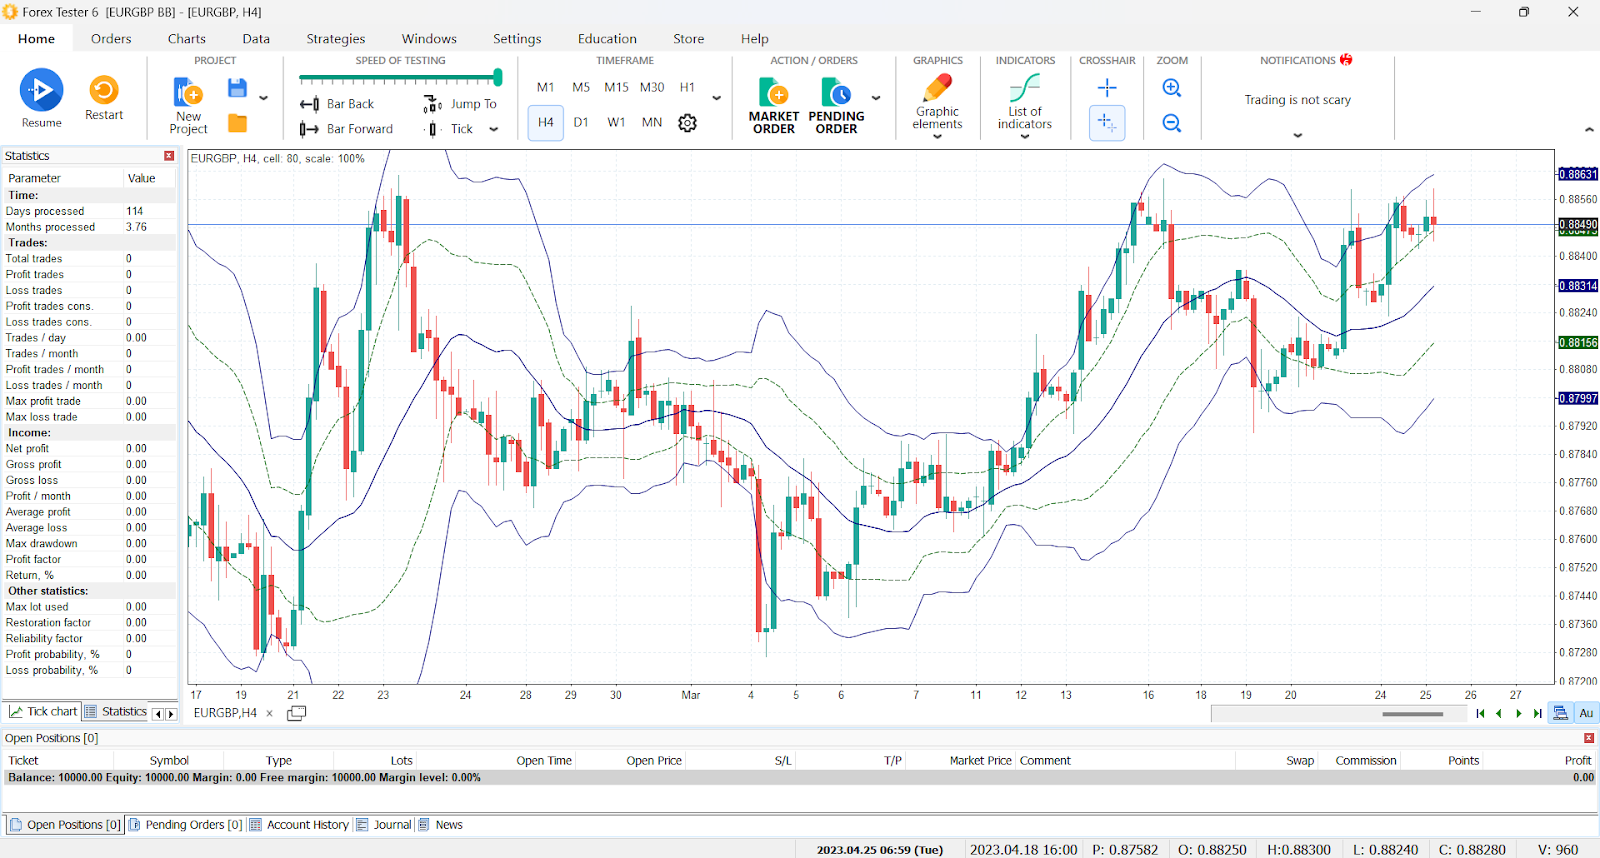
Figure 5: EURGBP H4 chart displaying a double Bollinger Bands setup using Forex Tester 6. The multiple bands create distinct trading zones with different standard deviations, allowing for more precise entry and exit strategies.
| Zone | Description | Action | Risk Level |
|---|---|---|---|
| Between 1SD bands | Normal price zone | Hold positions | Low |
| 1SD to 2SD | Extended move zone | Partial profit taking | Medium |
| Beyond 2SD | Extreme move zone | Full profit taking/reversal | High |
| Squeeze condition | Low volatility | Prepare for breakout | Variable |
Strategy #5: Bollinger + RSI Combination
Combining Bollinger Bands with the Relative Strength Index (RSI) creates a powerful confirmation system. This combination helps filter false signals and provides higher probability entries by confirming both price and momentum conditions.
🔄 BB + RSI Combo Rules
Bullish Setup: Price at lower BB + RSI below 30 (oversold)
Bearish Setup: Price at upper BB + RSI above 70 (overbought)
Entry Confirmation: RSI starts moving away from extreme levels
Strength Filter: RSI divergence adds conviction to reversal signals
Exit Strategy: RSI reaches opposite extreme or middle band touched
Success Rate: Approximately 75-80% in ranging markets
Advanced Bollinger Band Techniques
Professional traders employ sophisticated techniques to maximize Bollinger Band effectiveness. These advanced methods require deeper understanding but can significantly improve trading results when applied correctly.
Customizing Settings for Different Timeframes
While the standard 20,2 settings work well for daily charts, different timeframes may benefit from adjusted parameters. Shorter timeframes often require more sensitive settings, while longer timeframes can use less sensitive configurations to reduce noise.
| Timeframe | Recommended Period | Standard Deviation | Purpose |
|---|---|---|---|
| 1-5 Minutes | 10-15 | 1.5-2.0 | Scalping |
| 15-30 Minutes | 15-20 | 2.0 | Day Trading |
| 1-4 Hours | 20 | 2.0 | Swing Trading |
| Daily | 20-25 | 2.0-2.5 | Position Trading |
Multiple Timeframe Analysis
Professional traders always confirm Bollinger Band signals across multiple timeframes. This top-down approach significantly improves signal quality and reduces false breakouts. The key is ensuring alignment between different timeframe perspectives before entering trades.
📊 Multi-Timeframe Bollinger Analysis
Higher Timeframe: Determines overall trend and major S/R levels
Trading Timeframe: Provides entry and exit signals
Lower Timeframe: Fine-tunes entry timing and confirms momentum
Alignment Rule: Trade only when at least 2 out of 3 timeframes agree
Conflict Resolution: Higher timeframe always takes precedence
Volume Confirmation Techniques
Volume analysis adds crucial context to Bollinger Band signals. High volume breakouts are more likely to sustain, while low volume band touches often result in false signals. Professional traders always consider volume patterns when interpreting Bollinger Band formations.
📊 Volume-Bollinger Integration
Breakout Confirmation: Volume should increase 50-100% above average during band breakouts
Squeeze Validation: Decreasing volume during squeeze formation confirms pattern
Band Touch Analysis: High volume touches more likely to hold as support/resistance
Divergence Signals: Price making new highs/lows while volume decreases warns of reversal
Continuation Patterns: Consistent volume during band walks confirms trend strength
Combining with Moving Averages
Adding additional moving averages to Bollinger Band analysis provides enhanced trend filtering and signal confirmation. The 50 and 200 EMAs are particularly effective when combined with the middle band (20 SMA) for comprehensive trend analysis.
Common Bollinger Band Mistakes
Even experienced traders make critical errors when using Bollinger Bands. Understanding and avoiding these common mistakes is essential for consistent profitability with this indicator.
Mistake #1: Trading Every Band Touch
The most common error is treating every band touch as a trading signal. In trending markets, band touches often signal continuation rather than reversal. Professional traders always consider market context before acting on band interactions.
⚠️ Solution: Context Analysis
Trend Assessment: Use higher timeframes to determine overall market direction
Volume Confirmation: Require volume confirmation for band touch signals
Pattern Recognition: Look for specific patterns (W-bottom, M-top) rather than simple touches
Multiple Indicators: Combine with RSI, MACD, or other indicators for confirmation
Patience: Wait for clear confirmation before entering trades
Mistake #2: Ignoring Trend Context
Many traders apply the same interpretation regardless of market condition. Bollinger Bands behave differently in trending versus ranging markets, and strategies must adapt accordingly.
Mistake #3: Using Wrong Settings for Timeframe
Using daily chart settings on 5-minute charts (or vice versa) leads to poor signal quality. Each timeframe has optimal settings that balance sensitivity with noise reduction.
Mistake #4: Poor Stop-Loss Placement
Placing stops too close to entry points results in premature exit during normal volatility. Bollinger Band trades require adequate breathing room for natural price fluctuations.
🛡️ Proper Stop-Loss Guidelines
Bounce Trades: Place stops 20-30 pips beyond band touch point
Breakout Trades: Use breakout candle low/high plus spread
Trend Trades: Middle band serves as logical stop level
Volatility Adjustment: Wider stops during high volatility periods
ATR Consideration: Use Average True Range to set appropriate stop distances
Mistake #5: Overcomplicating the Strategy
Adding too many indicators or complex rules often diminishes Bollinger Band effectiveness. The indicator works best when kept simple and focused on its core strengths: volatility measurement and mean reversion identification.
Frequently Asked Questions
📚 Related Articles
- → Technical Analysis for Beginners: Reading Forex Charts
- → Moving Averages: The Ultimate Guide for Forex Traders
- → RSI Indicator: How to Use Relative Strength Index in Forex
- → Support and Resistance: Master Key Levels for Forex Success
- → Volatility Trading Strategies: Profit from Market Uncertainty
- → Trend Trading: Riding the Wave to Consistent Profits
- → Breakout Trading: Catching Big Moves Early
Conclusion
Bollinger Bands represent one of the most versatile and reliable indicators in forex trading when used correctly. From identifying explosive breakout opportunities during squeezes to riding profitable trends through band walks, these dynamic bands provide a mathematical framework for understanding market volatility and price behavior.
The key to Bollinger Band mastery lies in understanding that they're not just simple overbought/oversold indicators. They're sophisticated tools that adapt to market conditions, providing context-dependent signals that require intelligent interpretation. Whether you're employing the bounce strategy in ranging markets, the breakout strategy during squeezes, or the trend continuation approach during band walks, success comes from patience, proper risk management, and continuous learning.
Remember that no indicator, regardless of its sophistication, guarantees trading success. Bollinger Bands are most effective when combined with solid risk management principles, proper market analysis, and realistic expectations. Start with paper trading to build confidence, gradually increase position sizes as you gain experience, and always prioritize capital preservation over aggressive profit-seeking.
The forex market's volatility creates countless opportunities for those who understand how to read and interpret Bollinger Bands correctly. With the strategies, patterns, and techniques covered in this guide, you now have the foundation to trade volatility like a professional. Practice these concepts consistently, adapt them to your trading style, and watch as your ability to profit from market volatility transforms your trading results.
⚠️ Risk Disclaimer
Forex trading involves substantial risk of loss and is not suitable for all investors. The high degree of leverage can work against you as well as for you. Before deciding to trade foreign exchange, you should carefully consider your investment objectives, level of experience, and risk appetite. The possibility exists that you could sustain a loss of some or all of your initial investment. Therefore, you should not invest money that you cannot afford to lose. Past performance is not indicative of future results. This article is for educational purposes only and should not be considered as financial advice. Always consult with a qualified financial advisor before making trading decisions.
Comments
Post a Comment